Consequences of Energy Deficits
1 Cellular Function Impairment
Inadequate ATP affects all cellular processes:
- Ion pumps: Na+/K+-ATPase consumes 20–40% of cellular ATP
- Protein synthesis: Highly energy-intensive process
- Cell signaling: Many signaling pathways require ATP
- Membrane function: Active transport and vesicle trafficking
2 Tissue-Specific Effects
Different tissues manifest energy deficits differently:
Muscle
- Weakness and fatigue with minimal exertion
- Early lactate accumulation
- Delayed recovery from activity
- Post-exertional pain and soreness
Brain
- Cognitive dysfunction (“brain fog”)
- Reduced neurotransmitter synthesis
- Impaired synaptic function
- Vulnerability to excitotoxicity
Immune Cells
- Impaired T cell activation (requires metabolic reprogramming)
- Reduced NK cell cytotoxicity
- Abnormal cytokine production
- Ineffective pathogen clearance
3 Calcium Toxicity, Exercise Chunking, and Threshold Dynamics
The calcium toxicity model (Section Cross-Cutting Mechanisms) has a critical therapeutic implication: calcium overload is a threshold phenomenon, not a linear dose-response. The Na+/K+-ATPase can maintain ionic homeostasis below a certain workload; above it, intracellular sodium accumulates faster than the pump can clear, NCX reverses, and calcium floods in. Damage is then proportional to the area above threshold, not to total work performed.
The Klimas reconditioning protocol (Chapter Lifestyle and Non-Pharmacological Interventions)—short exercise bouts separated by supine rests—may work specifically because it keeps intracellular sodium below the NCX reversal threshold throughout. Supine rest between bouts is critical for a precise reason: it restores muscular perfusion (by eliminating orthostatic demand), which restores aerobic ATP production, which powers the Na+/K+-ATPase to clear accumulated sodium before NCX reversal occurs. The rest period is a race between sodium clearance rate and the reversal threshold.
If correct, the optimal rest interval is patient-specific and depends on individual Na+/K+-ATPase kinetics (measurable via the Wirth-Scheibenbogen sodium MRI protocol). Compression stockings during exercise (by maintaining perfusion) should extend the tolerable bout duration before pump failure.
Testable predictions:
- (a): Two equal-total-work exercise sessions—one continuous, one chunked with supine rests—should produce dramatically different PEM severity, with the chunked session producing near-zero PEM if rest intervals are sufficient.
- (b): Intracellular sodium should return to baseline during properly timed supine rests, measurable by repeated sodium MRI.
- (c): Combining compression stockings with exercise chunking should allow longer bouts before sodium accumulation reaches the reversal threshold.
Treatment implication: Personalised exercise prescription based on sodium MRI-derived pump kinetics, rather than empirical activity restriction alone. Certainty: 0.40—the logic follows directly from the calcium toxicity model and known Na+/K+-ATPase physiology, but the threshold dynamics have not been directly measured during exercise chunking in ME/CFS.
4 Connection to Post-Exertional Malaise
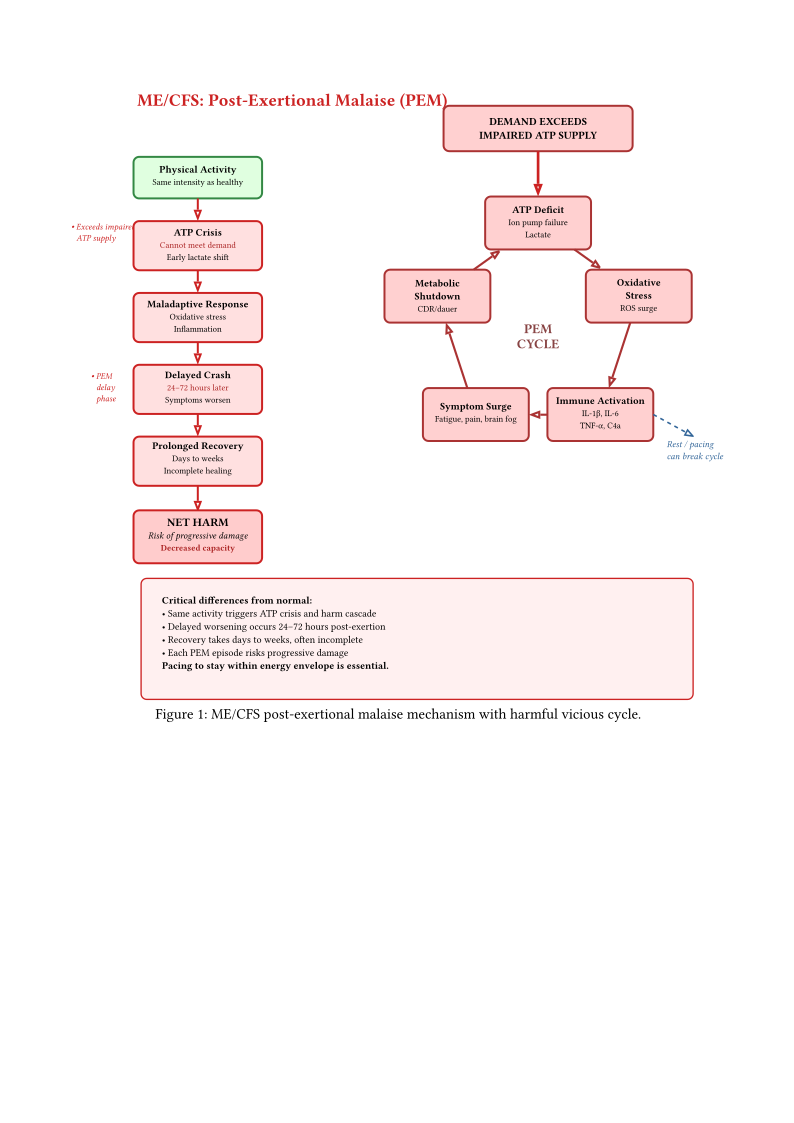
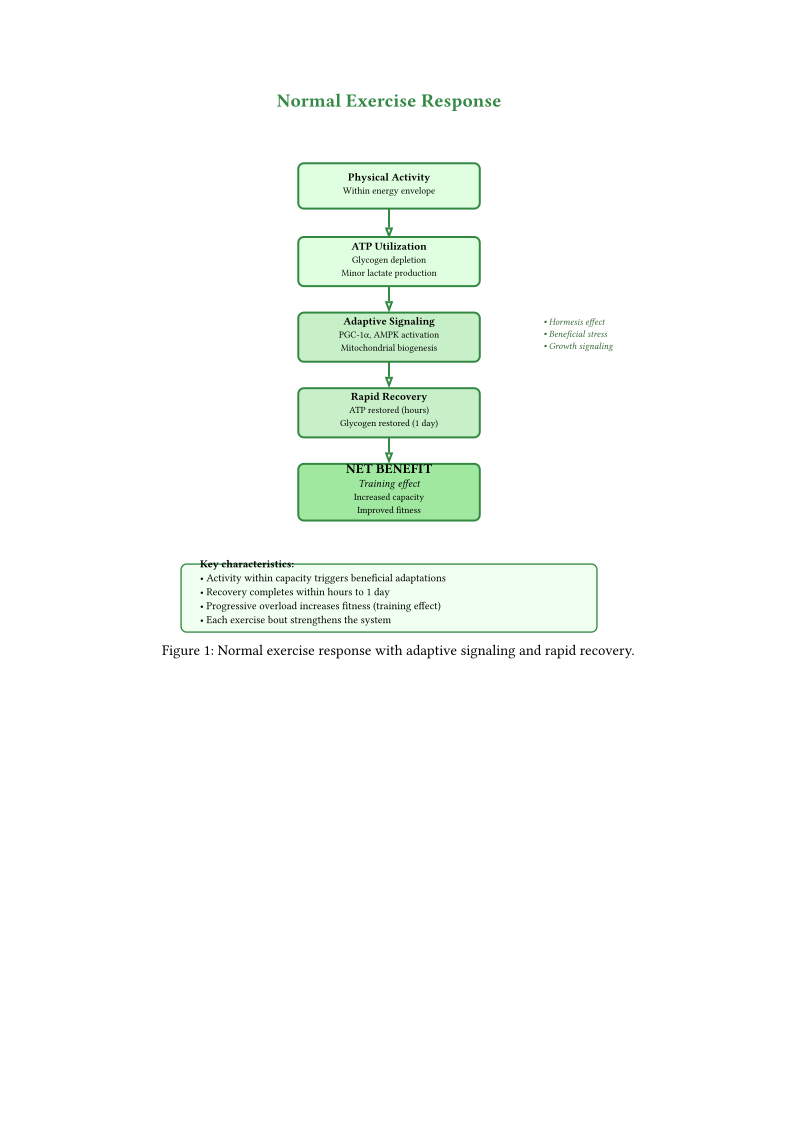
Mitochondrial dysfunction provides a compelling explanation for PEM:
- Limited reserve: Baseline energy production is already compromised
- Exercise stress: Activity depletes already-limited ATP stores
- Oxidative burst: Exercise generates additional ROS, damaging mitochondria further
- Delayed recovery: Impaired mitophagy and biogenesis slow restoration
- Cumulative damage: Each exertion may worsen mitochondrial function. Emerging evidence of satellite cell depletion in ME/CFS muscle suggests an additional structural dimension — inability to repair exertion-induced micro-damage to muscle fibres (see Satellite Cell Depletion as a Mechanism of Progressive Muscle Damage in ME/CFS)
- Symptom cascade: Energy deficit affects multiple organ systems
Figures pem normal and pem mecfs illustrate the critical distinction between normal exercise response (rapid recovery, positive adaptation) and ME/CFS PEM (ATP crisis, maladaptive inflammatory cascade, delayed deterioration). Repeated PEM episodes cause progressive decline.
The Effort-Performance Disconnect: Physiological Mechanisms
The profound subjective experience described in Section Post-Exertional Malaise (PEM)—the sensation of “giving everything” yet achieving minimal output—has direct physiological correlates that distinguish ME/CFS from psychological disorders or deconditioning. A 2026 direct comparison of 60-day strict bed rest in healthy volunteers against ME/CFS and Long COVID muscle biopsies confirmed that the patient phenotype is qualitatively different from deconditioning at multiple independent levels (glycolytic shift, Type I-selective atrophy, OXPHOS–V̇O₂ₘₐₓ uncoupling, capillary density differences), none of which are reproduced by prolonged disuse (Charlton et al. 2026).
Central Nervous System Effort Signaling:
The brain’s effort-generating systems appear to function normally or even hyperactivate in ME/CFS:
- Motor cortex activation: fMRI studies suggest normal or increased motor cortex activation during attempted movement
- Catecholamine mobilization attempts: The brain attempts to mobilize energy reserves through sympathetic activation
- Subjective intensity: The sense of maximal effort reflects genuine CNS activation and stress response engagement
- Central command: Motor planning and initiation circuits generate normal or excessive drive
The Walitt et al. 2024 NIH study documented altered effort preference rather than reduced effort capability (Walitt et al. 2024). ME/CFS patients can generate effort signals, but the consequences of doing so (PEM) appropriately modify behavior. This represents adaptive learning, not primary motivation deficit.
Peripheral Energy Production Failure:
Despite normal or excessive central drive, peripheral tissues cannot respond proportionally:
- Mitochondrial ATP deficit: Muscle cells cannot generate sufficient ATP to sustain contraction despite receiving motor neuron signals
- Ion pump failure: Inadequate ATP impairs Na+/K+-ATPase function, disrupting muscle excitability and contraction
- Calcium handling impairment: Energy-dependent calcium reuptake into sarcoplasmic reticulum fails, preventing muscle relaxation and subsequent contraction
- Metabolite accumulation: Lactate, hydrogen ions, and other metabolites accumulate rapidly, triggering muscle pain and afferent signaling
- Neuromuscular transmission stress: Repeated activation with insufficient recovery depletes neurotransmitter and impairs synaptic function
Cardiovascular Oxygen Delivery Limitations:
The two-day CPET data demonstrate that oxygen delivery and utilization fail during and after exertion (Keller et al. 2024):
- Chronotropic incompetence: Heart rate fails to increase appropriately, limiting cardiac output
- Reduced stroke volume: Autonomic dysfunction impairs venous return and cardiac filling
- Impaired oxygen extraction: Oxygen pulse (VO2/HR) declines on Day 2, suggesting reduced tissue oxygen uptake
- Ventilatory limitation: Reduced ventilation limits oxygen availability even when respiratory muscles receive motor commands
The Subjective-Objective Mismatch Explained:
This creates a situation unique to ME/CFS:
Central effort generation: Brain generates normal or maximal effort signals → subjectively feels like “giving everything”
Peripheral energy failure: Muscles receive commands but cannot execute due to ATP deficit, ion pump failure, oxygen delivery limitation → minimal force production, minimal work output
Afferent feedback: Massive signaling from muscle (metabolite accumulation, tissue hypoxia, cellular stress) returns to brain → reinforces sensation of extreme exertion
Autonomic stress response: Sympathetic activation (elevated heart rate, norepinephrine release attempt) further intensifies subjective sense of emergency
Observable output: Despite all this internal activation and distress, actual work performed is minimal → external observers see “not trying hard enough”
Learned Helplessness as Accurate Pattern Recognition:
The development of learned helplessness in ME/CFS differs fundamentally from learned helplessness in depression:
Accurate perception: Patients accurately perceive that their maximal effort does not produce expected outcomes—this is not a cognitive distortion but a direct experiential truth
Appropriate behavioral adaptation: Reducing effort expenditure after learning it produces crashes represents adaptive learning, not pathological avoidance
Physiological validation: Two-day CPET objectively documents that effort Day 1 produces measurable impairment Day 2, validating patient perception
Controllability assessment: In classic learned helplessness paradigms, outcomes are truly uncontrollable; in ME/CFS, outcomes are controllable through limitation (pacing works), making the adaptation rational
The psychological distress arises not from cognitive distortion but from accurate recognition of one’s physiological limitations in a world structured around normal energy availability. The helplessness is realistic—patients genuinely cannot reliably produce normal output despite normal or excessive subjective effort expenditure.
Vulnerability as Physiological Reality:
The sense of extreme vulnerability—“I wouldn’t amount to shit in a fight”—reflects accurate assessment of current physiological capacity:
- Energy unavailability for defense: Fight-or-flight responses require massive ATP mobilization; ME/CFS patients cannot sustain this
- Delayed consequences: Any acute energy expenditure (fleeing danger, defending self) would trigger severe PEM, leaving the patient even more vulnerable for days to weeks afterward
- Dependence on others: Inability to reliably generate protective physical responses creates realistic dependence
- Identity disruption: For patients previously defined by physical capability, this represents genuine loss, not negative self-perception
This vulnerability is not imagined or exaggerated—it is a direct consequence of documented metabolic, cardiovascular, and mitochondrial dysfunction that prevents reliable energy mobilization on demand.
5 Exercise-Induced Metabolic Failure: Two-Day CPET Evidence
The most compelling objective evidence for exercise-induced metabolic failure comes from two-day cardiopulmonary exercise testing (CPET) protocols. Unlike single-day assessments that may be confounded by deconditioning or effort, the two-day protocol documents the failure to reproduce initial performance after 24 hours—a hallmark of post-exertional malaise (Keller et al. 2024). A 2026 null replication found no significant group-average Day 2 VO₂ decline ((Mancini et al. 2026)), though both studies concur on elevated perceived exertion and chronotropic incompetence—consistent signals of exercise-imposed physiological burden regardless of the group-average VO₂ result.
Two-Day CPET Protocol and Rationale
The two-day CPET protocol requires maximal exercise tests on consecutive days, separated by 24 hours. Healthy individuals and those with deconditioning typically maintain or slightly improve performance on Day 2 after familiarization with the protocol. In contrast, ME/CFS patients show consistent, reproducible declines.
In the largest rigorous two-day CPET study to date, Keller and colleagues examined 84 ME/CFS participants (Canadian Criteria) and 71 sedentary controls across multiple sites (Keller et al. 2024). The study design included a matched subset (55 pairs) controlled for sex, age, and baseline aerobic capacity, allowing assessment of whether observed abnormalities were attributable to deconditioning.
ME/CFS participants demonstrated consistent, reproducible declines in multiple cardiopulmonary parameters on Day 2: peak oxygen consumption (VO2peak) declined by 5.3% (p < 0.01), work output by 5.5% (p < 0.01), ventilation by 7.8% (p < 0.01), heart rate by 2.6% (p < 0.05), oxygen pulse by 4.0% (p < 0.05), and anaerobic threshold VO2 by 6.7% (p < 0.05). In contrast, control participants showed no significant changes in any parameter between Day 1 and Day 2.
Critically, when ME/CFS participants were matched with controls having identical baseline VO2peak (aerobic capacity), the abnormal Day 2 responses persisted, demonstrating that impaired recovery is not attributable to fitness level but represents a disease-specific pathophysiological process. This provides the most rigorous objective validation of post-exertional malaise to date, distinguishing ME/CFS from deconditioning and validating PEM as a reproducible biological phenomenon rather than subjective experience.
The two-day CPET abnormality has been observed in earlier smaller studies (Snell 2013, Stevens 2014), and Keller 2024 is the largest and most rigorously controlled. However, all major studies originate from overlapping research networks. Fully independent replication by groups without prior involvement would strengthen confidence.
Critical analysis of the Keller 2024 data reveals important limitations for diagnostic or biomarker utility (ME/CFS Science 2024c). While the group-level Day 2 decline is statistically significant, the VO2peak decline (\(-5.1%\) in ME/CFS versus \(-2%\) in controls) represents a moderate effect size with substantial overlap between groups—many individual ME/CFS patients show no Day 2 decline, and some controls show declines in the ME/CFS range. The Bell Disability Scale, commonly used to measure ME/CFS functional capacity, showed near-zero correlation with CPET parameters (\(\rho = -0.009\) for VO2peak), suggesting that exercise testing captures a dimension of pathophysiology that is largely independent of patient-reported disability (ME/CFS Science 2024c).
Additionally, the mecfsscience.org analysis[^1] identified three methodological concerns in the broader two-day CPET literature (ME/CFS Science 2024b): (1) conflicting data values appearing in different publications from the same dataset, (2) improbable clustering of zero-difference results in some analyses, and (3) circular reasoning in patient/control separation where the criterion for group assignment overlaps with the outcome variable. These concerns do not invalidate the finding of Day 2 decline but suggest the effect size and diagnostic specificity may be overstated in some publications.
The two-day CPET is therefore best understood as a research tool demonstrating the biological reality of PEM at the group level, rather than as a clinical diagnostic test for individual patients.
5.1 Deconditioning Alone Cannot Explain ME/CFS Exercise Intolerance
A persistent alternative explanation for exercise intolerance in ME/CFS is that patients are merely deconditioned from inactivity. Note that deconditioning may be a contributing factor (as discussed above in the mitophagy section, which describes deconditioning as both a consequence and a cause of mitochondrial quality control failure through reduced AMPK signaling). The claim examined here is the stronger one: whether deconditioning is a sufficient explanation. NASA bed rest studies provide a direct test of this stronger claim (ME/CFS Science 2024d). In controlled bed rest experiments, prolonged immobilization produces measurable deconditioning—but the resulting phenotype differs qualitatively from ME/CFS:
- Magnitude: Bed rest deconditioning produces mild fatigue that is readily distinguished from the profound energy failure in ME/CFS
- Reversibility: Deconditioning reverses rapidly with reconditioning programmes; ME/CFS exercise intolerance shows no improvement on objective measures (actometry, Day 2 CPET) with graded exercise, and many patients report worsening — though some report subjective improvement on self-rated outcomes in unblinded trials (see Chapter Symptom-Based Management for evidence discussion)
- VO2max range: ME/CFS patients’ aerobic capacity typically falls in the 10th–25th percentile of population norms—reduced, but within the range of sedentary individuals rather than in the severely deconditioned range (ME/CFS Science 2024d) (Keller et al. 2024). This overlap complicates the distinction: the VO2max values of ME/CFS patients and sedentary but healthy controls overlap substantially, meaning that aerobic capacity alone cannot differentiate between deconditioning and ME/CFS-specific pathology. The Day 2 CPET decline (Achievement Two-Day CPET: Objective Validation of Post-Exertional Malaise) provides the additional discriminating evidence.
- Birth cohort evidence: As reviewed by mecfsscience.org, prospective birth cohort studies show no association between pre-illness physical activity levels and subsequent development of ME/CFS, arguing against a deconditioning pathway (ME/CFS Science 2024d)
5.2 Effort-Independent Thresholds and Activity Matching Refute Deconditioning in Long COVID
Beyond the bed-rest comparator (Section Two-Day CPET: Biomarker Utility Limitations), two additional lines of rebuttal distinguish Long COVID PEM from deconditioning (Appelman et al. 2025). First, the lower gas exchange threshold and respiratory compensation point in Long COVID patients with PEM are effort-independent: they emerge from the cardiopulmonary exercise test regardless of whether the patient is maximally exerted, so they cannot be dismissed as a product of low motivation or effort avoidance. Second, when patients were re-matched to controls by objective physical activity (step count, 5181 vs 4727 steps/day), the group difference in exercise capacity persisted (V̇O2max −24%, p=0.004; peak power output −31%, p=0.043). Matching by activity level therefore does not eliminate the deficit, directly rebutting the claim that the exercise limitation is a consequence of physical inactivity. Consistent with the bed-rest comparator in Chapter ME/CFS Through the Lens of Universal Disease Mechanisms, Long COVID patients also showed no reduction in capillarization or fibre cross-sectional area and a qualitative reduction in intrinsic mitochondrial respiration (not a loss of mitochondrial content), a phenotype distinct from disuse (Appelman et al. 2025). Together with the ME/CFS two-day CPET evidence (Achievement Two-Day CPET: Objective Validation of Post-Exertional Malaise), these effort-independent and activity-matched findings in Long COVID provide convergent objective support, across these two post-viral populations, that the exercise intolerance is disease-specific rather than deconditioning-driven.
5.3 The Boom-and-Bust Model: Accelerometer Evidence
The “boom-and-bust” behavioral model posits that ME/CFS patients alternate between overexertion on “good days” and prolonged recovery, maintaining illness through a maladaptive activity pattern. This model has informed some cognitive behavioral therapy (CBT) approaches and graded exercise therapy (GET) recommendations, though proponents of these approaches also cite deconditioning and fear-avoidance models as complementary rationales. Multiple accelerometer studies measuring objective physical activity patterns have not found boom-and-bust cycling as the dominant activity pattern in established ME/CFS patients (ME/CFS Science 2024a):
- Objective activity monitoring shows ME/CFS patients maintain remarkably stable, low activity levels rather than the peaks and troughs predicted by boom-and-bust theory
- Symptom exacerbations (crashes) occur without preceding activity spikes, indicating they reflect PEM biology triggered by normal daily activities rather than behavioral overexertion
- The data are more consistent with a pathologically low activity threshold for triggering PEM than with pathologically high activity levels, suggesting the boom-and-bust model misidentifies the source of the problem
An alternative interpretation deserves consideration: the stable low activity levels observed in accelerometer studies may themselves reflect successful adaptive behavior by patients who have learned to pace effectively. On this reading, the absence of boom-bust peaks is evidence that pacing works, not that the boom-bust pattern never existed. Longitudinal studies capturing the transition from early illness (before pacing is learned) to established illness would help distinguish between these interpretations.
These findings support the interpretation that PEM is a biological phenomenon better managed through pacing-based approaches (Chapter Symptom-Based Management) than through behavioral modification via CBT or GET.
Impairment Severity Worsening
Based on anaerobic threshold criteria, impairment classification shifted dramatically:
- Day 1: 14% classified as severely impaired
- Day 2: 27% classified as severely impaired (nearly doubled)
This demonstrates that exertional stress unmasks or exacerbates functional impairment.
The two-day CPET findings are consistent with the mitochondrial dysfunction framework:
VO2peak decline: Reduced maximal oxygen consumption indicates impaired oxidative metabolism at the tissue level—either reduced oxygen delivery (cardiovascular), oxygen extraction (cellular uptake), or oxygen utilization (mitochondrial dysfunction)
Anaerobic threshold shift: Earlier reliance on anaerobic metabolism suggests mitochondria cannot meet energy demands through oxidative phosphorylation, forcing premature lactate production
O2 pulse reduction: Oxygen pulse (VO2/heart rate) reflects stroke volume or oxygen extraction; its decline suggests either cardiac dysfunction or impaired peripheral oxygen utilization
Ventilatory dysfunction: Reduced ventilation at maximal effort may reflect central respiratory drive impairment (consistent with brainstem/autonomic dysfunction) or metabolic signaling abnormalities
Chronotropic incompetence: Reduced heart rate response indicates autonomic nervous system dysregulation affecting cardiac control
Autonomic Dysregulation as Primary Mechanism
Keller and colleagues concluded that autonomic nervous system dysregulation affecting blood flow and oxygen delivery represents the primary mechanism linking these abnormalities (Keller et al. 2024). This integrates with the Walitt study’s findings of reduced central catecholamines (Section Catecholamine Metabolism: NIH Study Findings)—catecholamines are essential for autonomic cardiovascular regulation during exercise.
Complementarity with Walitt 2024 NIH Study
The two-day CPET findings complement the NIH deep phenotyping study (Walitt et al. 2024):
- Walitt: Documented reduced CSF catecholamines, altered effort preference due to temporoparietal junction dysfunction, metabolic abnormalities, and single-day CPET showing reduced VO2peak and chronotropic incompetence
- Keller: Demonstrated that exercise Day 1 produces measurable physiological impairment on Day 2, validating PEM as a reproducible phenomenon with objective correlates
Together, these studies establish that:
- Central catecholamine deficiency impairs effort generation and autonomic control
- Exertional stress on Day 1 further compromises already-limited energy metabolism
- Recovery processes fail to restore baseline function within 24 hours
- The functional impairment is measurable, reproducible, and distinct from deconditioning
Clinical Implications for Activity Management
The two-day CPET findings provide a quantitative foundation for pacing strategies:
- Heart rate thresholds: Staying below anaerobic threshold (often estimated as AT \(-\) 15 bpm) may prevent Day 2 impairment
- Recovery periods: Activity sufficient to trigger metabolic stress requires >24 hours for restoration
- Graded exercise therapy contraindication: Progressive increases in exertion worsen measurable physiological function rather than improving fitness
- Disability documentation: Two-day CPET provides objective, reproducible evidence of functional impairment for benefits/insurance claims
Recovery Kinetics Beyond 24 Hours
While the Keller study assessed only 24-hour recovery, clinical observations and Cornell Center research suggest full restoration requires approximately 13 days for ME/CFS patients compared to \(\sim\) 2 days for sedentary controls. This prolonged recovery period likely reflects:
- Impaired mitophagy delaying removal of damaged mitochondria
- Reduced mitochondrial biogenesis slowing replacement
- Persistent oxidative stress from the exertional episode
- Systemic inflammation triggered by metabolic stress