Selective Energy Dysfunction Hypothesis
A patient with severe ME/CFS cannot walk to the bathroom, cannot sustain a conversation, cannot tolerate light or sound — yet their hair continues to grow at a normal rate. Their nails grow. These clinical observations derive from patient self-reports and informal clinical experience; no published study has formally measured hair or nail growth rates in ME/CFS patients. Nevertheless, the consistency of these reports across diverse patient populations poses a fundamental challenge to the “global energy failure” model of ME/CFS: if mitochondrial dysfunction were truly systemic, all energy-dependent processes should be impaired proportionally. (Note: wound healing was previously included among preserved processes but has been removed — see Section Is Wound Healing Actually Impaired in ME/CFS? for the evidence that this assumption was unsupported.)
This chapter proposes that ME/CFS represents selective rather than global energy dysfunction—specifically, a CNS coordination failure that impairs demand-responsive, CNS-dependent processes while sparing autonomous local processes that operate independently of central regulation.
The foundational claim that hair growth, nail growth, and other autonomous processes are preserved in ME/CFS derives from patient self-reports and informal clinical experience. No published study has formally measured hair growth rate or nail growth rate in ME/CFS patients compared to matched controls. These processes may in fact be subtly impaired without patients noticing, or they may appear preserved because their energy demands are negligible relative to the total energy budget even in health. The “selective vs. global” distinction may therefore be a continuum rather than a dichotomy, and the motivating observation could be an artefact of measurement insensitivity.
Wound healing — previously listed among preserved processes — has been removed from this framework. Wound healing is a complex, multi-phase, demand-responsive cascade requiring NK cell mobilisation, autonomic vascular regulation, and substantial energy expenditure. No study has measured wound healing in ME/CFS patients. Mechanistic evidence from three independent pathways — NK cell dysfunction (Baraniuk, Eaton-Fitch, and Marshall-Gradisnik 2024) (Sobecki et al. 2021), sympathetic overactivation (Xue et al. 2018), and immune exhaustion (Stanojcic et al. 2016) — each based on single studies with substantial caveats, suggests abnormal healing dynamics rather than normal preservation. The assumption of preservation is unsupported, but so is the prediction of impairment — direct measurement is needed (see Chapter Energy Metabolism and Mitochondrial Function Section Is Wound Healing Actually Impaired in ME/CFS? for full analysis).
1 Motivation and Clinical Observations
The selective dysfunction hypothesis emerged from a simple observation: processes that require CNS coordination and scale with demand are severely impaired in ME/CFS, while processes that operate autonomously at the local tissue level remain intact.
Preserved (minimal CNS dependency):
- Hair growth—local follicle autonomous cycle
- Nail growth—keratinocyte autonomous proliferation
- Basal cardiac automaticity—SA node intrinsic pacing
- Baseline digestion—enteric nervous system (“second brain”)
Severely impaired (high CNS dependency):
- Exercise capacity—requires CNS motor coordination + autonomic scaling
- Cognitive function—intrinsically CNS-dependent
- Orthostatic regulation—requires real-time CNS autonomic control
- Temperature regulation—hypothalamic coordination
- Sleep architecture—brainstem and cortical orchestration
This pattern motivates the formal selective dysfunction hypothesis developed below (Hypothesis Selective Dysfunction Hypothesis).
2 Formal Framework
We formalize the selective dysfunction hypothesis using three quantitative definitions that enable testable predictions.
For any biological process \(P\), define the CNS-dependency index \(\delta_{\text{CNS}}(P) \in [0,1]\) as:
\[ \delta_{\text{CNS}}(P) = (N_{\text{CNS}}(P)) / (N_{\text{total}}(P)) \]
where \(N_{\text{CNS}}(P)\) is the number of regulatory signals requiring CNS coordination and \(N_{\text{total}}(P)\) is the total number of regulatory signals controlling process \(P\).
- \(\delta_{\text{CNS}} = 0\): Fully autonomous (no CNS involvement)
- \(\delta_{\text{CNS}} = 1\): Fully CNS-dependent (all regulation via CNS)
- \(\delta_{\text{CNS}} \in (0,1)\): Mixed regulation
For process \(P\), define the demand-responsiveness index \(\rho(P) \in [0, \infty)\) as:
\[ \rho(P) = (max_{\text{challenge}} \text{Output}(P) - \text{Output}_{\text{baseline}}(P)) / (\text{Output}_{\text{baseline}}(P)) \]
where:
- \(\rho = 0\): Constant output (no demand scaling)
- \(\rho > 0\): Output increases under challenge
- \(\rho > 1\): Output can more than double under maximal demand
For standardization to \([0,1]\), we use \(\sim(\rho)(P) = (\rho(P)) / (1 + \rho(P))\).
Note on negative demand-response: Some processes decrease output under challenge (e.g., digestive function during fight-or-flight response, where blood flow diverts to skeletal muscle). For such processes, we define \(\rho(P) = 0\) because the selective dysfunction hypothesis specifically addresses upregulation capacity—the ability to increase output when demanded. Processes with negative demand-response represent regulatory suppression rather than capacity limitation, and require separate modeling frameworks (not within this hypothesis).
The predicted dysfunction severity for process \(P\) in ME/CFS is:
\[ S(P) = \alpha dot \delta_{\text{CNS}}(P) + \beta dot \sim(\rho)(P) + \gamma dot \delta_{\text{CNS}}(P) dot \sim(\rho)(P) \]
where:
- \(\alpha > 0\): Weight for CNS-dependency (main effect)
- \(\beta > 0\): Weight for demand-responsiveness (main effect)
- \(\gamma > 0\): Weight for interaction (synergistic vulnerability)
The interaction term \(\gamma dot \delta_{\text{CNS}} dot \sim(\rho)\) captures synergistic vulnerability: processes that are both CNS-dependent and demand-responsive are predicted to be most severely affected.
Note on range: \(S(P) \in [0, \alpha + \beta + \gamma)\). Since \(\sim(\rho) = \rho/(1+\rho) < 1\) strictly for any finite \(\rho\), the supremum \(\alpha + \beta + \gamma = 1.5\) is approached but never attained. Values exceeding $ 1.0$ indicate severe predicted dysfunction (see Table Table Values Are Illustrative, Not Independent Validation).
In ME/CFS, dysfunction severity \(S_{\text{observed}}(P)\) correlates strongly with predicted severity \(S(P)\):
\[ S_{\text{observed}}(P) = S(P) + \epsilon \]
where \(\epsilon\) is residual error. Working assumption: \(\epsilon \sim \mathcal{N}(0, \sigma^2)\) (normally distributed with mean zero); this assumption requires validation against empirical data.
Testable prediction: Spearman correlation \(\rho_s\) between \(S(P)\) and \(S_{\text{observed}}(P)\) across processes should satisfy \(\rho_s > 0.7\) (strong positive correlation).
Independence requirement: For this prediction to be independently falsifiable, \(\delta_{\text{CNS}}(P)\) and \(\sim(\rho)(P)\) must be estimated from sources other than ME/CFS clinical observations—for example, from neuroanatomical pathway counts in healthy individuals and demand-scaling measurements in healthy controls. The current Table Table Values Are Illustrative, Not Independent Validation values are expert estimates that partly reflect the clinical picture the model aims to predict; using them directly would make the correlation circular and non-falsifiable.
Falsification criterion: If \(\rho_s < 0.3\) when tested with independently estimated parameters, the hypothesis is refuted.
Certainty: 0.55 (moderate evidence from clinical observations, formal testing required)
The CNS-dependency index \(\delta_{\text{CNS}}\), demand-responsiveness index \(\sim(\rho)\), and dysfunction severity \(S(P)\) are defined mathematically but have never been fitted to empirical data. The parameter values in Table Table Values Are Illustrative, Not Independent Validation are “expert estimates” that partly reflect the clinical picture the model aims to predict — as acknowledged in the independence requirement (line 104). Until \(\delta_{\text{CNS}}\) and \(\sim(\rho)\) are estimated from independent sources (neuroanatomical pathway counts, healthy-control demand-scaling measurements), the correlation between predicted and observed dysfunction severity is circular. The weights \(\alpha\), \(\beta\), \(\gamma\) have not been estimated from data and the interaction term’s contribution is unknown. The framework is therefore a formalised heuristic, not a validated quantitative model.
3 Evidence Taxonomy
The \(\delta_{\text{CNS}}\) and \(\sim(\rho)\) values in Table Table Values Are Illustrative, Not Independent Validation are expert estimates that partly reflect the clinical picture the model aims to predict. Using these values to test the correlation \(\rho_s > 0.7\) would be circular and non-falsifiable. Independent validation requires estimating parameters from sources outside ME/CFS clinical observations (e.g., neuroanatomical pathway counts in healthy individuals). The table illustrates the model’s framework and internal consistency; it does not constitute evidence for or against the hypothesis. See Predictions Hair Follicle Mitochondrial Function–Cognitive Triage Hierarchy for independently testable predictions.
Table Table Values Are Illustrative, Not Independent Validation classifies biological processes by their predicted and observed dysfunction status.
| Process | \(\delta_{\text{CNS}}\) | \(\sim(\rho)\) | Predicted \(S\) | Observed | Certainty |
|---|---|---|---|---|---|
| Preserved processes (low \(\delta_{\text{CNS}}\), low \(\rho\)) | |||||
| Hair growth† | 0.1 | 0.0 | 0.06 | Preserved | 0.4 |
| Nail growth† | 0.1 | 0.0 | 0.06 | Preserved | 0.4 |
| Basal cardiac automaticity | 0.15 | 0.0 | 0.09 | Preserved | 0.7 |
| Digestion (baseline)‡ | 0.3 | 0.2 | 0.30 | Variable | 0.5 |
| Impaired processes (high \(\delta_{\text{CNS}}\) and/or high \(\rho\)) | |||||
| Exercise capacity | 0.8 | 0.8 | 1.14 | Severe | 0.9 |
| Cognitive function | 1.0 | 0.5 | 1.05 | Severe | 0.9 |
| Orthostatic regulation | 0.9 | 0.7 | 1.14 | Severe | 0.85 |
| Temperature regulation | 0.8 | 0.4 | 0.81 | Moderate-Severe | 0.7 |
| Sleep architecture | 0.9 | 0.3 | 0.80 | Severe | 0.8 |
| Immune response to challenge | 0.5 | 0.7 | 0.79 | Dysregulated | 0.65 |
Notes: \(S\) calculated with \(\alpha = 0.6\), \(\beta = 0.5\), \(\gamma = 0.4\). Values \(>1.0\) indicate severe predicted dysfunction (additive model; theoretical supremum \(= \alpha + \beta + \gamma = 1.5\), never attained since \(\sim(\rho) < 1\) strictly). Certainty reflects confidence in classification based on literature review.
† Hair and nail growth: Certainty 0.4 reflects that “preserved” status is based on patient self-reports and informal clinical experience; no formal study has measured growth rates in ME/CFS patients.
‡ Digestion (baseline): The \(\sim(\rho) = 0.2\) value reflects demand-up scaling under normal eating conditions. The fight-or-flight suppression of digestion (a negative demand-response) is modeled separately as \(\rho = 0\) per the convention in Definition Demand-Responsiveness Index.
ME/CFS patients consistently show preserved baseline function with impaired challenge response:
- Orthostatic challenge: 91–100% show abnormal CBF reduction during tilt-table testing, with 3-fold greater reduction than controls (C. Linda M. C. van Campen et al. 2020)
- Exercise challenge: 2-day CPET reveals decline on day 2 (vs. improvement in controls) (Keller et al. 2024)
- Cognitive challenge: Fatigue elevated 24–48h post-cognitive task (C. Linda M. C. van Campen, Rowe, and Visser 2023)
This pattern is diagnostic: baseline function is maintained, but the system cannot scale to meet increased demand. This is precisely what the selective dysfunction model predicts for high-\(\rho\) processes. ## Causal Structure
Figure selective dysfunction dag presents the causal structure for selective dysfunction. The key feature is the absence of clinically significant causal paths from the CNS energy crisis node to preserved autonomous processes. Note: the figure includes a feedback edge from exercise intolerance to CNS energy crisis (representing PEM-induced CNS burden, certainty 0.35), which introduces a cycle; the structure is therefore a causal diagram rather than a strict directed acyclic graph (DAG).
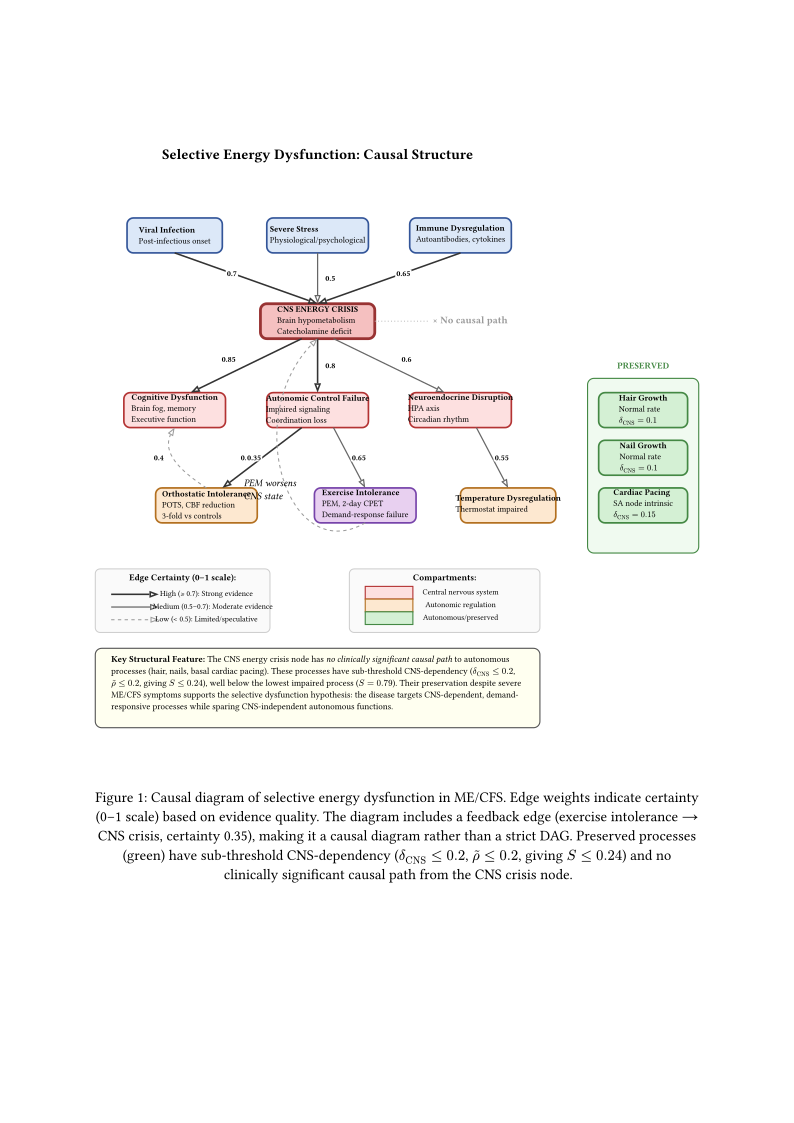
The causal diagram encodes the following claims with certainty-weighted edges:
- Triggers → CNS Energy Crisis (certainty: 0.65–0.70): Viral infection, immune dysregulation, or severe stress initiates CNS energy deficit (Komaroff and Lipkin 2023)
- CNS Crisis → Cognitive Dysfunction (certainty: 0.85): Direct effect of brain hypometabolism (Nakatomi et al. 2014) (Walitt et al. 2024)
- CNS Crisis → Autonomic Control Failure (certainty: 0.80): Impaired CNS signaling disrupts autonomic regulation (C. Linda M. C. van Campen et al. 2020)
- Autonomic Failure → Orthostatic Intolerance (certainty: 0.75): Secondary to failed cardiovascular coordination (C. Linda M. C. van Campen et al. 2020)
- Sub-threshold edge: CNS → Autonomous Processes: Hair/nails (\(\delta_{\text{CNS}} = 0.1\), \(\sim(\rho) = 0\): \(S = 0.06\)) and basal cardiac automaticity (\(\delta_{\text{CNS}} = 0.15\), \(\sim(\rho) = 0\): \(S = 0.09\)) fall in the preserved range of Table Table Values Are Illustrative, Not Independent Validation; all yield \(S \leq 0.24\), well below the lowest impaired process (\(S = 0.79\), immune response to challenge)
4 Mechanistic Sub-Hypotheses
Three hypotheses (certainty \(\geq 0.45\)) and two speculations (certainty \(< 0.45\)) explain why CNS might be selectively vulnerable. These mechanisms are not mutually exclusive; multiple pathways may act additively in individual patients.
4.1 Astrocyte Energy Gate Hypothesis
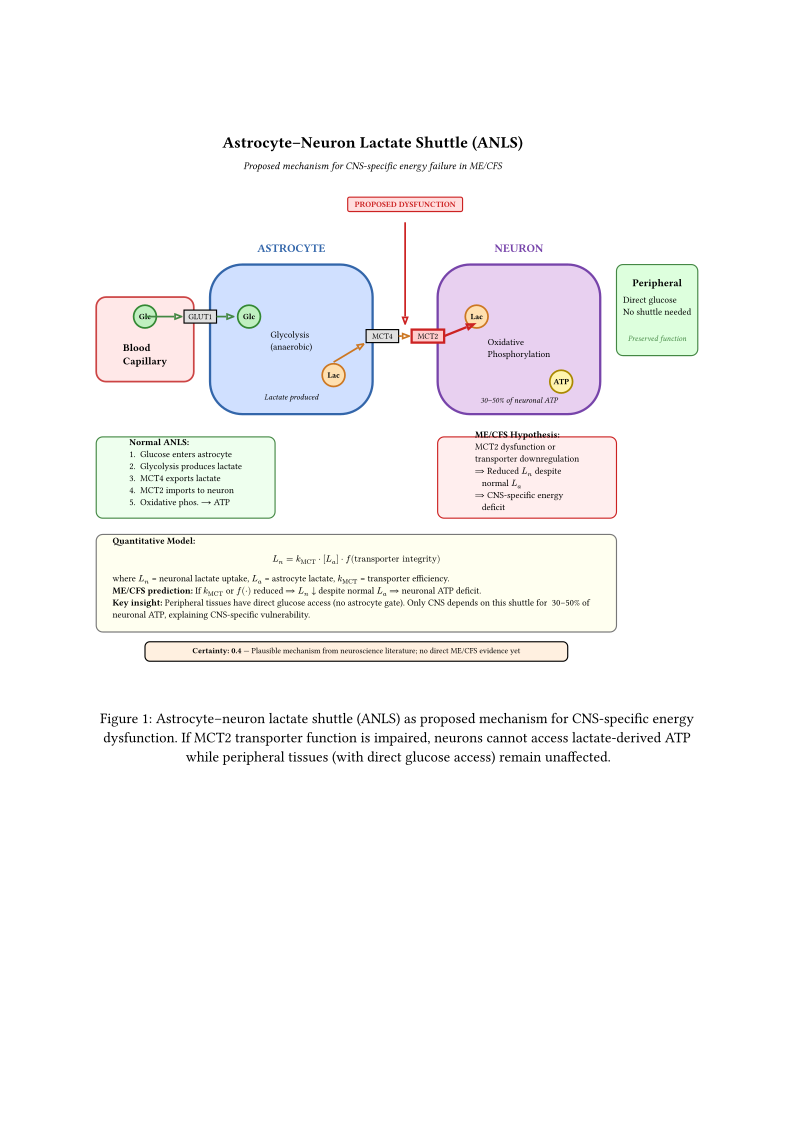
The astrocyte-neuron lactate shuttle (ANLS) provides 30–50% of neuronal ATP (Pellerin and Magistretti 1994) (Magistretti and Allaman 2018). Unlike peripheral tissues with direct glucose access, neurons depend on astrocytes to convert glucose to lactate and shuttle it via monocarboxylate transporters (MCT2/MCT4). An independently developed brain energy disorder model for ASD converges on the same ANLS failure mechanism, providing cross-disease validation (Blagojevic-Stokic et al. 2026) (Section Brain Energy Metabolism: Cross-Disease Convergent Framework).
Dysfunction in the astrocyte-neuron lactate shuttle causes CNS-specific energy failure while peripheral tissues (with direct glucose access) remain unaffected.
Mechanism:
$ L_n &= k_(“MCT”) dot [L_a] dot f(“transporter integrity”)
E_n &= g(L_n, “mitochondrial function”) $
where \(L_n\) = neuronal lactate uptake, \(L_a\) = astrocyte lactate concentration, \(k_{\text{MCT}}\) = MCT transporter efficiency, \(E_n\) = neuronal ATP production.
ME/CFS hypothesis: Reduced \(k_{\text{MCT}}\) or impaired \(f(dot)\) ⇒ \(L_n \downarrow\) despite normal \(L_a\) ⇒ CNS-specific energy deficit.
Certainty: 0.5 (plausible mechanism from neuroscience; ME/CFS-specific astrocytic glucose metabolism evidence now documented (Xu et al. 2026); originally 0.40, bumped +0.10 in Phase 6 retrospective adaptation)
Figure astrocyte lactate shuttle illustrates the ANLS mechanism and proposed dysfunction site.
4.2 CNS Energy Triage Hypothesis
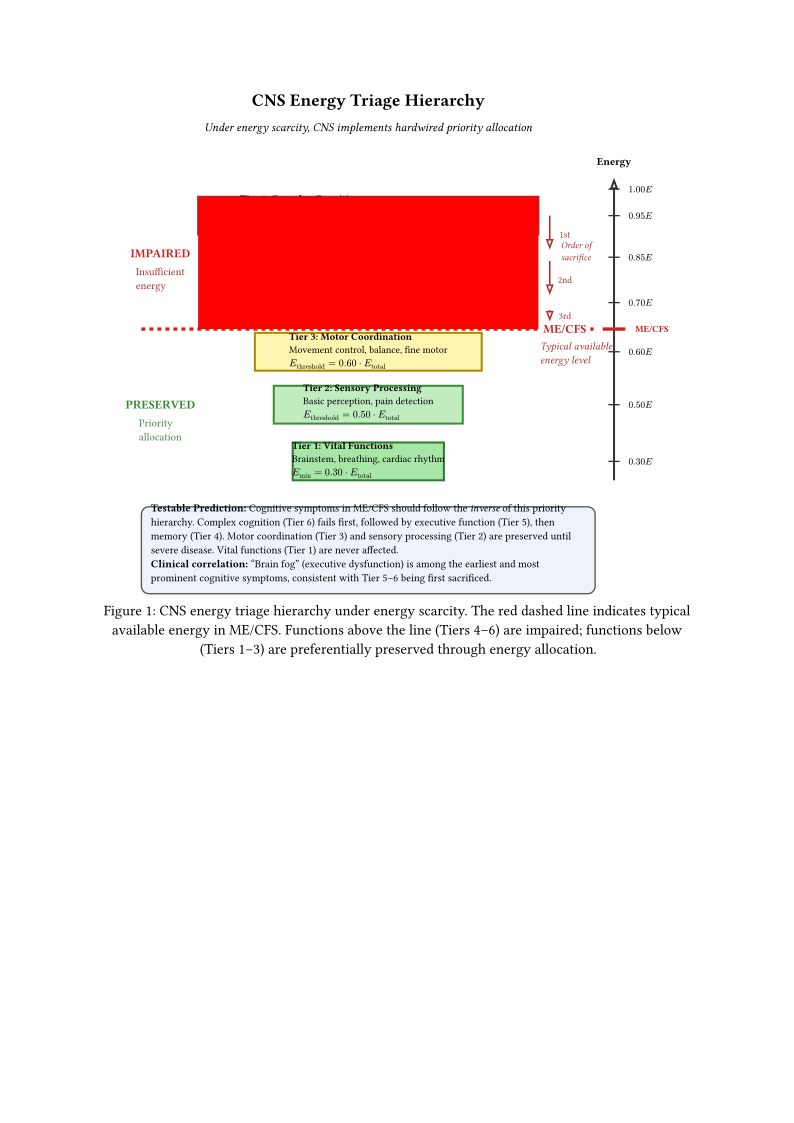
Under energy scarcity, the CNS may implement a hardwired priority hierarchy that preserves vital functions at the expense of “luxury” cognitive processes.
The CNS implements a priority-based energy allocation system under scarcity:
- Tier 1 (never sacrificed): Brainstem vital functions — \(E_{\text{min}} = 0.30 dot E_{\text{total}}\)
- Tier 2: Sensory processing — \(E_{\text{threshold}} = 0.50 dot E_{\text{total}}\)
- Tier 3: Motor coordination — \(E_{\text{threshold}} = 0.60 dot E_{\text{total}}\)
- Tier 4: Memory consolidation — \(E_{\text{threshold}} = 0.70 dot E_{\text{total}}\)
- Tier 5: Executive function — \(E_{\text{threshold}} = 0.85 dot E_{\text{total}}\)
- Tier 6 (first sacrificed): Complex cognition — \(E_{\text{threshold}} = 0.95 dot E_{\text{total}}\)
Note on threshold values: The \(E_{\text{min}}\) and \(E_{\text{threshold}}\) fractions (0.30, 0.50, 0.60, 0.70, 0.85, 0.95) are model parameters estimated for heuristic purposes, not empirically derived values. They reflect qualitative evidence about neural energy priorities (Magistretti and Allaman 2018) but have not been measured directly in ME/CFS or in healthy humans.
Prediction: Cognitive symptoms should follow the inverse hierarchy. Complex cognition fails first; vital functions never fail.
Clinical correlation: “Brain fog” (executive dysfunction, Tier 5–6) is among the earliest and most prominent symptoms, consistent with these tiers being sacrificed first.
Certainty: 0.5 (consistent with observed symptom hierarchy; convergent cross-disease evidence from ASD brain energy disorder model (Blagojevic-Stokic et al. 2026); formal testing needed)
Figure energy triage hierarchy visualizes the triage hierarchy with the typical ME/CFS energy threshold.
4.3 Blood-Brain Barrier Vulnerability Hypothesis
The blood-brain barrier (BBB) creates a unique vulnerability: damage signals may accumulate in the CNS while peripheral clearance continues normally.
The BBB traps mitochondrial damage markers and limits cofactor delivery, causing CNS-specific accumulation of dysfunction.
Steady-state model:
\[ [M]_{\text{CSF}} = [M]_{\text{blood}} + (R_{\text{production}}) / (P_{\text{BBB}} dot k_{\text{clear}}) \]
where \([M]\) = damage marker concentration (mass/volume), \(R_{\text{production}}\) = CNS production rate (mass/volume/time), \(P_{\text{BBB}} dot k_{\text{clear}}\) = effective BBB-mediated clearance rate (1/time), and \([M]_{\text{blood}}\) = peripheral (blood) concentration treated as a fixed boundary condition set by systemic clearance. At steady state, CNS production is balanced by BBB-mediated efflux of the excess above blood levels.
Ratio consequence: \(\dfrac{[M]_{\text{CSF}}}{[M]_{\text{blood}}} = 1 + \dfrac{R_{\text{production}}}{P_{\text{BBB}} dot k_{\text{clear}} dot [M]_{\text{blood}}}\). In healthy subjects this ratio is near $ 1$; in ME/CFS, reduced \(P_{\text{BBB}}\) or elevated \(R_{\text{production}}\) drives it above $ 1$, indicating CNS-specific accumulation.
ME/CFS prediction: If \(P_{\text{BBB}}\) is reduced or \(R_{\text{production}}\) elevated, the CSF/blood ratio increases, indicating CNS-specific accumulation.
Testable: Measure mtDNA, 8-OHdG, or other damage markers in paired CSF and blood samples. Elevated CSF/blood ratio supports hypothesis.
Certainty: 0.45 (BBB dysfunction documented in neuroinflammation (Nakatomi et al. 2014); ME/CFS-specific data limited)
4.4 Sickness Behavior Persistence Hypothesis
Evolutionary sickness behavior programs target behavioral outputs (requiring CNS) while sparing truly autonomous processes.
ME/CFS represents a sickness behavior program that fails to disengage, chronically suppressing CNS-mediated behavioral outputs while leaving autonomous local processes unaffected.
Activation function:
\[ \text{SB}(t) = op(\text{sigm})(\sum_{i} w_i \cdot [\text{cytokine}_i](t) - \theta) \]
where \(op(\text{sigm})(x) = 1/(1+e^{-x})\) is the logistic sigmoid function (distinct from standard deviation \(\sigma\) used elsewhere in this chapter), \(w_i\) are cytokine weights, and \(\theta\) is the activation threshold.
Normal state: Acute infection elevates cytokines ⇒ SB activates ⇒ infection resolves ⇒ cytokines normalize ⇒ SB deactivates.
ME/CFS state: Chronic low-grade immune activation maintains \(\sum w_i \cdot [\text{cytokine}_i] > \theta\) indefinitely ⇒ SB persists.
Evolutionary logic: Sickness behavior evolved to suppress behavioral energy expenditure during infection. Hair growth has no behavioral component and was never targeted by this program.
Certainty: 0.55 (strong evolutionary logic; moderate mechanistic support from neuroimaging (Nakatomi et al. 2014))
4.5 Partial Torpor Trap Hypothesis
ME/CFS may represent incomplete engagement of torpor-like metabolic suppression mechanisms.
ME/CFS involves partial engagement of torpor/hibernation pathways with failed arousal, trapping patients in a low-metabolic state.
Torpor engagement dynamics:
\[ (d(\text{MR})) / (d t) = -k_T dot T_{\text{signal}} + k_A dot A_{\text{signal}} - \lambda(\text{MR} - \text{MR}_0) \]
where MR = metabolic rate, \(T_{\text{signal}}\) = torpor induction signal, \(A_{\text{signal}}\) = arousal signal, \(k_T, k_A > 0\) are signal gain coefficients (distinct from the \(\alpha, \beta\) weights in the \(S(P)\) formula), \(\lambda > 0\) is a restoring rate constant, and \(\text{MR}_0\) is the baseline metabolic rate. The restoring term \(-\lambda(\text{MR} - \text{MR}_0)\) ensures a bounded steady state at \(\text{MR}^* = \text{MR}_0 + (k_A A - k_T T)/\lambda\).
Normal torpor: \(k_T T > k_A A\) during entry (MR suppressed below \(\text{MR}_0\)); \(k_A A > k_T T\) during arousal (MR restored toward \(\text{MR}_0\)).
ME/CFS state: \(k_T T > k_A A\) chronically, so \(\text{MR}^* < \text{MR}_0\) (trapped in partial suppression).
Testable markers: Torpor-associated molecules (H2S, adenosine, orexin) may be dysregulated.
Certainty: 0.35 (speculative; inspired by emerging torpor biology research (Hrvatin et al. 2020) (Takahashi et al. 2020))
5 Testable Predictions
The selective dysfunction hypothesis generates specific, falsifiable predictions.
Hypothesis: Hair follicle mitochondria are functionally normal in ME/CFS patients.
Measurement: Mitochondrial respiration (oxygen consumption rate, OCR) in plucked hair follicle cells.
Statistical design:
- Test type: Equivalence test (TOST procedure)
- Equivalence margin: \(\delta = 0.2 \times macron(x)_{\text{control}}\) (20% of control mean)
- Sample size: \(n = 40\) per group (power = 0.8, \(\alpha = 0.05\))
- Outcome: ME/CFS OCR equivalent to control OCR
Interpretation:
- If confirmed: Strong support for selective (not global) mitochondrial dysfunction
- If refuted (ME/CFS OCR significantly lower): Global dysfunction model supported
Feasibility: Hair follicle collection is minimally invasive; mitochondrial respiration assays are established.
Hypothesis: CSF lactate is elevated relative to blood lactate in ME/CFS, indicating impaired lactate shuttling in CNS.
Measurement: Paired CSF and blood lactate concentrations.
Statistical design:
- Test type: Two-sample \(t\)-test on ratio \([L]_{\text{CSF}}/[L]_{\text{blood}}\)
- Expected effect size: Cohen’s \(d \geq 0.5\) (medium effect)
- Sample size: \(n = 64\) per group (power = 0.8, \(\alpha = 0.05\))
- Outcome: Ratio elevated in ME/CFS vs. controls
Interpretation:
- If confirmed: Supports astrocyte energy gate hypothesis
- If refuted: Lactate shuttle not primary mechanism
Hypothesis: Peripheral muscle ATP is preserved during PEM crashes (dysfunction is coordination failure, not local energy deficit).
Measurement: 31P-MRS of skeletal muscle during provoked PEM.
Statistical design:
- Test type: Repeated measures ANOVA (baseline vs. PEM)
- Expected: No significant decline in muscle ATP during PEM
- Comparison: CNS metabolic markers (via PET/MRS) should decline while peripheral markers remain stable
Interpretation:
- If confirmed: Dysfunction is CNS coordination failure, not peripheral energy deficit
- If refuted (peripheral ATP drops): Global depletion model supported
Hypothesis: Direct electrical stimulation of muscles produces greater force than voluntary contraction in ME/CFS patients.
Rationale: If dysfunction is CNS coordination failure, bypassing CNS via direct stimulation should restore output. Consistent with this prediction, neuromuscular electrical stimulation (NMES) in fully sedated ICU patients — a model of absent CNS motor drive — completely prevented muscle atrophy, confirming that electrically stimulated muscle can be preserved without CNS input (Dirks et al. 2015). An RCT in ICU showed NMES + passive activity training attenuated atrophy more than passive training alone (Bao et al. 2022). Whether NMES is safe in ME/CFS (does electrically-induced contraction trigger PEM?) is the critical unanswered question — see Section NMES/EMS for Muscle Preservation in Bedbound ME/CFS — Unknown PEM Risk and NMES as Hypothetical CNS Bypass for Muscle Preservation in Severe ME/CFS for the clinical research gap.
Measurement: Compare force production: voluntary maximal contraction vs. electrical stimulation.
Expected: \(F_{\text{electrical}} / F_{\text{voluntary}} > 1\) in ME/CFS (vs. ratio \(\approx 1\) in controls).
Interpretation:
- If confirmed: Peripheral muscle capable; CNS drive impaired
- If refuted: Peripheral muscle intrinsically impaired
Current evidence state: The 1990s studies found normal electrically-stimulated force in ME/CFS, favouring a central-only limitation (Gibson et al. 1993) (Edwards et al. 1993) (Jamal and Miller 1991). More recent direct-stimulation measures find a peripheral membrane defect (reduced M-wave amplitude, lengthened duration, tracking sarcolemmal oxidative stress) (Jammes and Retornaz 2019) (Vecchiet et al. 2003), and in-vitro electrical pulse stimulation fails to activate AMPK/glucose in ME/CFS muscle (Brown et al. 2015). The field has therefore moved from a “central-only” to a “central plus peripheral” account — the ratio is likely intermediate, not cleanly \(> 1\) or \(\approx 1\).
Hypothesis: Cognitive impairment in ME/CFS follows the inverse of the energy triage hierarchy.
Measurement: Cognitive battery assessing each tier:
- Tier 6 (complex cognition): Abstract reasoning, creativity
- Tier 5 (executive function): Planning, multitasking, attention
- Tier 4 (memory): Working memory, recall
- Tier 3 (motor coordination): Fine motor, reaction time
- Tier 2 (sensory processing): Basic perception
Expected: Impairment severity: Tier 6 > Tier 5 > Tier 4 > Tier 3 > Tier 2.
Statistical test: Ordinal regression testing hierarchy effect.
6 Subtype Classification Model
The selective dysfunction framework suggests natural subtypes based on primary compartment affected.
ME/CFS can be classified into subtypes based on which compartment shows primary dysfunction:
Input features (with measurement basis):
\(x_1\): CSF catecholamine deficit (z-score relative to healthy controls)
- Measurement: CSF dopamine, norepinephrine, serotonin metabolites
- Reference: NIH deep phenotyping study found significant CSF catecholamine reductions (Walitt et al. 2024)
\(x_2\): Orthostatic CBF reduction (% decline from supine to upright)
- Measurement: Transcranial Doppler during tilt-table test
- Reference: Controls show \(\sim\) 5–10% reduction; ME/CFS shows \(\sim\) 20–30% (3-fold greater) (C. Linda M. C. van Campen et al. 2020)
\(x_3\): Muscle ATP deficit at rest (% below control mean)
- Measurement: 31P-MRS of quadriceps or forearm
- Reference: Variable findings in literature; some studies show 20–40% reduction (Wirth and Scheibenbogen 2021) (Jammes et al. 2021)
\(x_4\): Neuroimaging abnormality score (composite z-score)
- Measurement: PET neuroinflammation markers, fMRI activation patterns, MRS metabolites
- Reference: Nakatomi et al. found 45–199% elevation in neuroinflammation markers (Nakatomi et al. 2014)
Proposed classification rules (preliminary thresholds):
The following thresholds are preliminary estimates based on effect sizes in the literature. They require empirical validation through clustering analysis on a multi-biomarker cohort before clinical application.
Note on units: Thresholds use z-scores (\(\sigma\)) for standardized measures and absolute percentages (%) for CBF changes, reflecting conventions in respective literatures.
\[ \begin{aligned} \text{Subtype A (CNS-Primary)} &: x_1 < -1.5 \sigma \wedge x_4 > 2 \sigma \wedge x_3 > -0.5 \sigma \\ & \quad \text{(CNS markers abnormal, peripheral spared)} \\ \text{Subtype B (Autonomic-Primary)} &: x_2 > 25% \wedge x_1 > -1.0 \sigma \\ & \quad \text{(OI dominant, CNS markers near-normal)} \\ \text{Subtype C (Peripheral-Primary)} &: x_3 < -1.5 \sigma \wedge x_1 > -1.0 \sigma \wedge x_4 < 1 \sigma \\ & \quad \text{(Muscle deficit primary, CNS spared)} \\ \text{Subtype D (Global/Advanced)} &: \geq 3 \text{of} {x_1 < -1.5 \sigma, x_2 > 25%, x_3 < -1.5 \sigma, x_4 > 2 sigma} \\ & \quad \text{(Multi-system involvement)} \end{aligned} \]
Threshold rationale:
- \(-1.5\sigma\): Corresponds to approximately the 7th percentile of control distribution—outside normal variation
- $ 2$: Corresponds to approximately the 98th percentile—clearly elevated
- $ 25%$ CBF reduction: Approximately 2.5\(\\times\) the normal orthostatic response (note: this is an absolute percentage, not a z-score, reflecting how CBF changes are typically reported in the literature)
Subtype E (Unclassified): Patients meeting fewer than 3 criteria for Subtype D and not meeting full criteria for Subtypes A, B, or C are classified as Subtype E (Unclassified/Sub-threshold). This category captures early-stage disease, atypical presentations, or patients whose biomarkers fall in the moderate range below all classification thresholds. Subtype E is expected to be common under this preliminary scheme and should be a priority for threshold revision during validation.
Overlap precedence: When a patient meets criteria for multiple subtypes:
- If \(\geq 3\) criteria met ⇒ classify as Subtype D (Global) regardless of other matches
- Otherwise, convert all features to z-scores for comparison (convert the CBF percentage \(x_2\) to a z-score using the control distribution mean and SD before comparing magnitude); assign to the subtype with the largest absolute z-score deviation; if tied, prioritize CNS-Primary \(\\>\) Autonomic-Primary \(\\>\) Peripheral-Primary (reflecting the hypothesis that CNS dysfunction is upstream)
- Document secondary subtype features for treatment consideration
Validation protocol required:
- Collect multi-biomarker panel in \(n \geq 200\) ME/CFS patients (sample size rationale: with 4 subtypes and 4 input features, minimum 50 patients per subtype needed for stable cluster estimation; \(n = 200\) provides robustness against unequal subtype prevalence and allows 10% holdout for validation, with \(k\)-fold cross-validation to compensate for small holdout size)
- Perform unsupervised clustering (k-means, hierarchical) to identify natural groupings
- Compare data-driven clusters to proposed subtypes
- Calculate sensitivity/specificity for each classification rule
- Refine thresholds based on ROC analysis to optimize classification accuracy
Treatment implications (contingent on validation):
- Subtype A: CNS-penetrant compounds, intranasal delivery, neuroinflammation-targeted therapy
- Subtype B: Autonomic modulators (midodrine, pyridostigmine), volume expansion
- Subtype C: Mitochondrial support, muscle-targeted interventions. Warning: Graded exercise is contraindicated in ME/CFS due to PEM risk even when CNS markers appear spared; any activity increase requires careful symptom monitoring and pacing principles (National Institute for Health and Care Excellence 2021)
- Subtype D: Multi-system approach, sequential targeting of dominant compartments
Certainty: 0.35 (framework theoretically motivated; all thresholds are preliminary estimates requiring empirical validation before any clinical application)
The four-subtype classification (CNS-Primary, Autonomic-Primary, Peripheral-Primary, Global/Advanced) has not been tested against patient data. The classification thresholds (\(-1.5\sigma\), $ 2$, $ 25%$ CBF reduction) are preliminary estimates, not data-derived cut-points. No multi-biomarker cohort study has simultaneously measured CSF catecholamines, orthostatic CBF, muscle ATP, and neuroimaging abnormalities in ME/CFS patients to determine whether natural clusters correspond to these proposed subtypes. The Subtype E (Unclassified) category may capture the majority of patients, rendering the classification clinically impractical. Treatment stratification based on these subtypes is entirely hypothetical.
7 Treatment Implications
The selective dysfunction hypothesis has immediate treatment implications.
7.1 Pharmacological Bypass Evidence
Midodrine (direct \(\alpha_1\)-adrenergic agonist) improves orthostatic symptoms in patients with POTS and orthostatic intolerance—conditions highly comorbid with ME/CFS—by directly stimulating peripheral vasculature, bypassing CNS autonomic coordination (Ojha, McNeeley, et al. 2024).
Implication: If peripheral targets were intrinsically dysfunctional, pharmacological bypass would not restore function. Midodrine effectiveness provides evidence consistent with intact peripheral machinery and impaired CNS coordination—though this inference is from a POTS-comorbid population and does not rule out a degree of peripheral dysfunction in ME/CFS more broadly.
This is consistent with the selective dysfunction model: the dominant problem may be signaling/coordination rather than end-organ failure. ### Therapeutic Strategy
- CNS-targeted delivery: Intranasal or intrathecal routes may outperform oral for CNS-targeted compounds
- Pharmacological bypass: Direct-acting agents that bypass CNS coordination (midodrine, direct muscle stimulation)
- Reduce CNS energy demands: Pacing as CNS energy management, not just “activity reduction”
- Subtype-specific targeting: Match intervention to primary dysfunction compartment (see subtype classification, Speculation Selective Dysfunction Subtypes)
For mechanism-specific treatment implications, see Section Model Interpretation, where each of the ten related hypotheses includes dedicated treatment and limitations paragraphs.
8 Compartmental Energy Model
Figure compartmental energy model presents the four-compartment energy model with CNS as the coordination bottleneck.
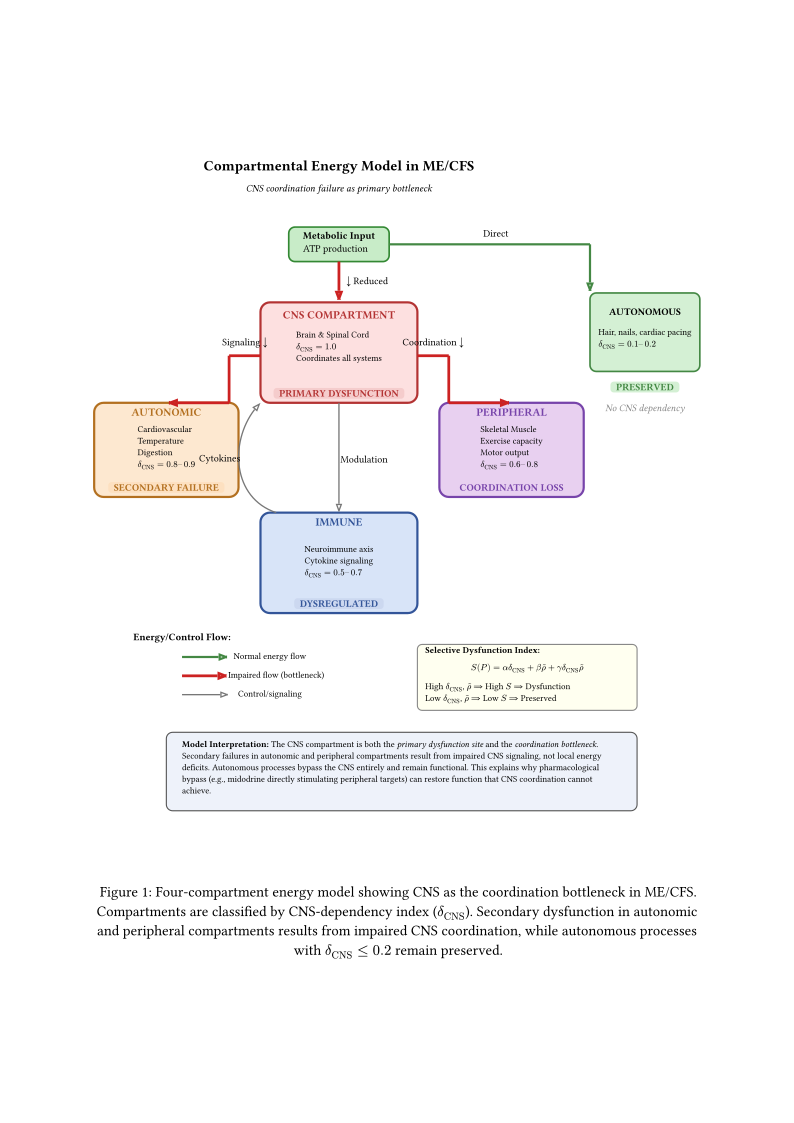
The CNS compartment serves dual roles:
- Primary dysfunction site: Brain hypometabolism, catecholamine deficiency
- Coordination bottleneck: Secondary failures in autonomic and peripheral compartments result from impaired CNS signaling, not local energy deficits
Autonomous processes bypass the CNS entirely and remain functional. This explains why:
- Hair grows normally (no CNS coordination required)
- Midodrine works (bypasses CNS, directly stimulates periphery)
- PEM affects demand-responsive but not baseline functions
10 Integration with Existing Hypotheses
The selective dysfunction hypothesis integrates with and extends existing models:
Metabolic Safe Mode (Section Metabolic “Safe Mode” Hypothesis): Selective dysfunction specifies which systems the safe mode affects (CNS-dependent, demand-responsive) and which it spares (autonomous)
Glymphatic Clearance Failure (Section Glymphatic/CSF Clearance Failure): Provides mechanism for CNS-specific waste accumulation within the BBB vulnerability sub-hypothesis
Autonomic Dysfunction (Chapter Cardiovascular Dysfunction): Reframes as CNS coordination failure rather than peripheral autonomic pathology
Mitochondrial Dysfunction (Chapter Energy Metabolism and Mitochondrial Function): Constrains location—mitochondrial dysfunction may be CNS-specific or CNS-predominant rather than global
The selective dysfunction hypothesis provides an internally consistent framework, but alternative explanations for the same clinical pattern have not been excluded:
- Scale artifact: Processes classified as “preserved” (hair, nail growth) have much lower absolute energy demands than “impaired” processes (exercise, cognition). A global but moderate energy deficit (e.g., 30% reduction) could spare low-demand processes while disabling high-demand ones — no selectivity mechanism required.
- Peripheral contributions: Impaired skeletal muscle oxygen extraction, documented in NIH deep phenotyping (Walitt et al. 2024), provides an alternative peripheral explanation for exercise intolerance that does not require CNS coordination failure as the primary bottleneck.
- Post-hoc fitting: The 17 hypotheses and speculations in this chapter were developed to explain known ME/CFS features. No prediction from this framework has been tested prospectively.
11 Limitations and Uncertainties
- Parameter estimation: The \(\delta_{\text{CNS}}\) and \(\rho\) values in Table Table Values Are Illustrative, Not Independent Validation are estimated, not empirically derived
- Interaction complexity: The additive model with interaction may oversimplify nonlinear relationships
- Heterogeneity: ME/CFS likely includes multiple pathophysiological subtypes; not all may fit this model
- Causal direction: The DAG assumes CNS dysfunction causes peripheral symptoms; reverse or bidirectional causation possible
- Evidence gaps: Direct tests of the hypothesis (hair follicle mitochondria, CSF lactate gradients) have not been performed
12 Summary
The selective energy dysfunction hypothesis proposes that ME/CFS preferentially affects CNS-dependent, demand-responsive biological processes while sparing autonomous local processes. This explains the paradox of preserved hair growth alongside severe functional impairment.
Key features:
- Formal quantification via CNS-dependency (\(\delta_{\text{CNS}}\)) and demand-responsiveness (\(\rho\)) indices
- Causal diagram with certainty-weighted edges (contains a feedback cycle; not a strict DAG)
- Three mechanistic hypotheses (Hypothesis CNS Energy Triage: CNS energy triage; Hypothesis BBB Compartmentalization: BBB vulnerability; Hypothesis Sickness Behavior Stuck On: sickness behavior persistence) and two speculations (Speculation Astrocyte Energy Gate: astrocyte energy gate; Speculation Partial Torpor Trap: partial torpor trap) explaining CNS selective vulnerability
- Ten related hypotheses and speculations extending the framework to sleep, gut-brain axis, autoantibodies, SFN, circadian rhythms, MCAS, memory, exercise physiology, post-viral reprogramming, and disease progression
- Specific, falsifiable predictions with statistical designs
- Natural subtype classification based on primary dysfunction compartment
- Treatment implications including pharmacological bypass, CNS-targeted delivery, and mechanism-specific interventions
Overall certainty: 0.55 (moderate)—hypothesis is consistent with clinical observations and supported by converging evidence from brain metabolism, autonomic dysfunction, and preserved autonomous function literature. Formal testing of predictions required.