Neurotransmitter Models
Neurotransmitter dynamics link energy metabolism, immune function, and neurological symptoms. The tryptophan–serotonin–kynurenine axis is particularly relevant to ME/CFS because it is modulated by both immune activation and energy status.
1 Tryptophan–Kynurenine Pathway
Tryptophan is metabolized through two competing pathways: serotonin synthesis (via tryptophan hydroxylase) and kynurenine production (via indoleamine 2,3-dioxygenase, IDO). Immune activation upregulates IDO, diverting tryptophan away from serotonin toward kynurenine and its downstream neurotoxic metabolites (quinolinic acid). The model tracks tryptophan (\(W\)), serotonin ($ 5 \(), and kynurenine (\)K$):
\[ \begin{aligned} \frac{d W}{d t} &= I_W - v_{\text{TPH}} \cdot \frac{W}{K_{\text{TPH}} + W} - v_{\text{IDO}} \cdot \frac{W}{K_{\text{IDO}} + W} - \delta_W W \\ \frac{d [5 \text{HT}]}{d t} &= v_{\text{TPH}} \cdot \frac{W}{K_{\text{TPH}} + W} - \delta_{5 \text{HT}} [5 \text{HT}] \\ \frac{d K}{d t} &= v_{\text{IDO}} \cdot \frac{W}{K_{\text{IDO}} + W} - \delta_K K \end{aligned} \tag{1}\]
where \(I_W\) is dietary tryptophan intake, and the IDO activity \(v_{\text{IDO}}\) is upregulated by IFN-\(\gamma\) from the immune model:
\[ v_{\text{IDO}} = v_{\text{IDO,basal}} + v_{\text{IDO,max}} \cdot \frac{[\text{IFN-} \gamma]^2}{K_{\text{IFN}}^2 + [\text{IFN-} \gamma]^2} \tag{2}\]
This coupling provides a mechanistic link between immune activation and neuropsychiatric symptoms: elevated IFN-\(\gamma\) \(->\) increased IDO activity \(->\) reduced serotonin and increased neurotoxic kynurenine metabolites. The IDO metabolic trap hypothesis (Phair, Davis, and Kashi 2019) extends this model by proposing bistability in IDO-2 kinetics, where a high-IDO state becomes self-sustaining even after the initial immune trigger resolves. Kynurenine pathway dysregulation has been documented in ME/CFS cohorts (Kavyani et al. 2022) (Dehhaghi et al. 2022).
2 Catecholamine Dynamics
The NIH deep phenotyping study documented altered catecholamine metabolites in ME/CFS cerebrospinal fluid (Walitt, Singh, LaMunion, Hallett, et al. 2024). Catecholamines (dopamine, norepinephrine, epinephrine) are synthesized from tyrosine through a sequential enzymatic pathway. The model tracks dopamine (\(\text{DA}\)) and norepinephrine (\(\text{NE}\)) in the CNS:
\[ \begin{aligned} \frac{d [\text{DA}]}{d t} &= v_{\text{TH}} \cdot \frac{[\text{Tyr}]}{K_{\text{TH}} + [\text{Tyr}]} \cdot \frac{[\text{BH}_4]}{K_{\text{BH}_4} + [\text{BH}_4]} - v_{\text{DBH}} \cdot \frac{[\text{DA}]}{K_{\text{DBH}} + [\text{DA}]} - \delta_{\text{DA}} [\text{DA}] \\ \frac{d [\text{NE}]}{d t} &= v_{\text{DBH}} \cdot \frac{[\text{DA}]}{K_{\text{DBH}} + [\text{DA}]} - \delta_{\text{NE}} [\text{NE}] \end{aligned} \tag{3}\]
where TH is tyrosine hydroxylase (rate-limiting), DBH is dopamine \(\beta\)-hydroxylase, and \([\text{BH}_4]\) is tetrahydrobiopterin—a cofactor shared with tryptophan hydroxylase and nitric oxide synthase. The shared BH₄ dependency creates competition: increased demand for BH₄ by one pathway (e.g., increased NO production during inflammation) reduces availability for catecholamine and serotonin synthesis. This provides a mechanistic explanation for the concurrent monoamine deficits observed in ME/CFS.
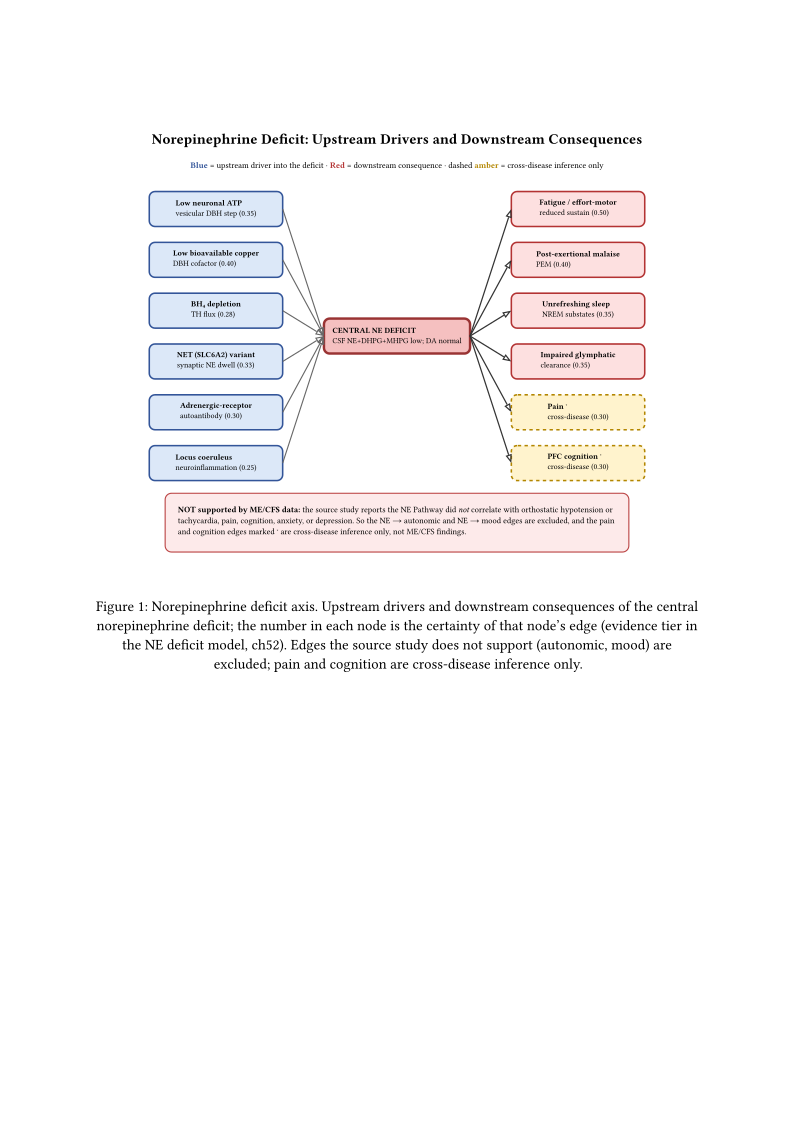
3 Norepinephrine Deficit: Upstream Drivers and Downstream Consequences
The preceding subsection models dopamine and norepinephrine synthesis (Equation catecholamines). This subsection adds the two features required to represent the ME/CFS noradrenergic phenotype: (1) the upstream factors that control the dopamine → norepinephrine (NE) step, and (2) the downstream symptom outputs attributed to NE. It assigns an evidence tier and a certainty to every edge, so the model does not assert more certainty than the data support.
3.1 Upstream control of the norepinephrine synthesis step
NE synthesis requires dopamine \(\beta\)-hydroxylase (DBH), which is localized to synaptic vesicles and depends on ATP (for the vesicular proton gradient) and on copper. The DBH flux is therefore scaled by ATP and copper availability:
\[ v_{\text{DBH}} = v_{\text{DBH}}^max \cdot \frac{[\text{ATP}]}{K_{\text{ATP}} + [\text{ATP}]} \cdot \frac{[\text{Cu}]}{K_{\text{Cu}} + [\text{Cu}]} \cdot \frac{[\text{DA}]}{K_{\text{DBH}} + [\text{DA}]} \tag{4}\]
Substituting Equation dbh upstream into Equation catecholamines shows why a low-ATP or low-copper state lowers NE while sparing dopamine: the ATP and copper factors act only on the DA → NE step, so the dopamine pool is preserved or accumulates. The model therefore reproduces the selective noradrenergic pattern reported by Aregawi et al. (Aregawi et al. 2026) as a model output rather than as an added assumption. The shared BH4 term (Equation bh4 dynamics) couples this step to inflammation.
Table 1 — Upstream edges (driver → NE synthesis).
| Driver | Mechanism / target | Evidence tier | Cert |
|---|---|---|---|
| Low neuronal ATP | Scales \(v_{\text{DBH}}\) down; blocks DA \(\rightarrow\) NE | Mechanism in vitro (Rangaraju, Calloway, and Ryan 2014); inference from selectivity | 0.35 |
| Low bioavailable copper | Scales \(v_{\text{DBH}}\) down | Review (Lutsenko et al. 2019); human inborn error (Senard and Rouet 2006) | 0.40 |
| BH4 depletion | Scales TH flux down; shared with NOS/TPH | Animal (Rivera et al. 2017) | 0.28 |
| NET (SLC6A2) loss-of-function | Alters synaptic NE dwell time | Human mutation, in vitro (Hahn, Robertson, and Blakely 2003) | 0.33 |
| Adrenergic-receptor autoantibody | Alters effective NE signalling at the receptor | In-vitro subgroup (Hartwig et al. 2020); null in POTS (Hall et al. 2022) | 0.30 |
| Locus coeruleus neuroinflammation | Reduces noradrenergic projection output | Multiple-sclerosis analogue (Ahmad, Alemani, and Feinstein 2026) | 0.25 |
3.2 Downstream outputs
Table 2 — Downstream edges (NE deficit → symptom), with the evidence tier for each.
| Output | Sign | Evidence tier | Cert |
|---|---|---|---|
| Fatigue / reduced effort-motor sustain | up | ME/CFS CSF correlation: handgrip \(r = 0.62\), MFI/PROMIS (Aregawi et al. 2026) (Walitt, Singh, LaMunion, and others 2024) | 0.50 |
| Post-exertional malaise | up | PASC-with-PEM subgroup only (Aregawi et al. 2026) | 0.40 |
| Unrefreshing sleep / arousal instability | up | Animal LC-NREM substates (Osorio-Forero et al. 2021); review (Lüthi and Nedergaard 2025) | 0.35 |
| Impaired glymphatic clearance | up | NE-vasomotion mechanism (Hauglund et al. 2025) (Zhu, Yang, and Hashimoto 2025) | 0.35 |
| Pain amplification | up | Cross-disease review (Hayashida and Obata 2019) | 0.30 |
| Prefrontal cognitive deficit | up | Rationale (Arnsten, Ishizawa, and Xie 2023) | 0.30 |
3.3 Edges the ME/CFS evidence does not support
The same study that reports the NE deficit also reports that the NE Pathway did not correlate with pain, cognition, anxiety, depression, orthostatic hypotension, or orthostatic tachycardia (Aregawi et al. 2026). These negative correlations constrain the model:
- NE deficit → autonomic cardiovascular symptoms: not supported (no correlation with orthostatic hypotension or tachycardia). The deficit tracks motor output and global health perception, not autonomic cardiovascular regulation. Do not model this edge.
- NE deficit → pain and → cognition: not supported by ME/CFS data (no correlation). The pain and cognitive edges in Table 2 are borrowed from other conditions and are marked as cross-disease inference; they are predictions, not ME/CFS findings.
- NE deficit → mood/anxiety: not supported (no correlation). Do not model this edge.
- NE deficit → muscle lactate or soreness: not modelled. \(\beta_2\)-adrenergic signalling raises muscle glycogenolysis and lactate (Jessen et al. 2020), so a deficit predicts lower, not higher, acute lactate; soreness is not lactate-mediated (Soreness Is Not Caused by Lactic Acid). The descending-analgesia route to soreness is the only defensible one and is already captured by the
painedge (Can an Adrenergic Deficit Explain Soreness or Excess Lactate?).
This distinction matters: a model that draws NE → autonomic and NE → mood edges would contradict the source data. The model keeps them out.
Self-reinforcing loops. Two feedback loops can make the deficit progressive: a clearance loop (NE down → vasomotion down → glymphatic clearance down → neuroinflammation up → LC output down → NE down), whose NE-to-clearance arm is supported (Hauglund et al. 2025) (Nedergaard 2026), and a microglial loop whose direction is contested (Bu et al. 2025) (Evans et al. 2024). These loops are the reason the model does not treat the deficit as a fixed static level: see The NE-Clearance Loop: A Self-Reinforcing Trajectory and Does Norepinephrine Suppress or Promote Neuroinflammation?, and The Noradrenergic Deficit as an Arousal-and-Clearance Regulator for the reframing.
Clinical expectation. The model’s supported outputs are fatigue/effort-motor and PEM; the sleep output is weaker (animal evidence). The excluded edges (autonomic, mood) and the unmodelled edges (soreness, lactate) predict that a noradrenergic agent should not change orthostatic heart rate, mood, soreness, or lactate. The symptom-level expectation map is in Section Drug Interactions — FDA Prescribing Information, Checked Online.
Falsifiable predictions. (a) In a severity-stratified ME/CFS cohort, at least one upstream driver in Table 1 (copper, BH4:BH2 ratio, DBH activity, NET genotype, adrenergic autoantibody) will track the CSF NE Pathway index. (b) The NE Pathway will predict effort/motor-sustain outcomes (handgrip, fatigue scores) but will not predict orthostatic heart-rate change or mood scores — reproducing the Aregawi dissociation. (c) A node-matched drug will improve the matched downstream domain in low-NE patients more than in normal-NE patients.
Limitations. No ME/CFS study measures any upstream driver in Table 1 against the NE Pathway. Every downstream edge except fatigue and PEM rests on animal or cross-disease evidence. The core finding is single-centre, n = 16, and uses an unvalidated composite index. The deconditioning confound is not eliminated. The upstream factors are not mutually exclusive.
Consequence: the model now states, edge by edge, which cause and which consequence the ME/CFS data actually support — so it predicts that a noradrenergic therapy should change fatigue and PEM, and should not be expected to change orthostatic heart rate or mood through this pathway.
Cross-references: Mast Cell MMP-9 → BBB Breakdown → Peripheral-CNS IL-11 Entry → Microglial Activation → More MMP-9 (narrative), The Noradrenergic Axis — Upstream Causes to Downstream Consequences (synthesis), Tetrahydrobiopterin Competition Model, Neurotransmitter Models.