The Energy Chain: Ten Steps from Substrate to ATP
Cellular ATP production proceeds in a chain of functionally dependent steps. Each step is necessary but not sufficient on its own, and failure at any one step can propagate to downstream capacity loss. This chapter organizes the chain into ten steps and reviews each step’s normal function, ATP accounting, documented ME/CFS findings, documented failure modes, and research gaps.
1 ATP Accounting Basis
ATP yields in this chapter are reported on a glucose basis: ATP molecules produced per mole of glucose fully oxidized under aerobic conditions. The textbook total is approximately 30–32 ATP per glucose, using consensus P/O ratios of 2.5 for NADH and 1.5 for FADH2 (Hinkle 2005). Each step is reported with three numbers: direct yield (ATP or ATP-equivalent reducing equivalents produced at this step), gated yield (downstream ATP that depends on this step completing), and percent of total (gated yield / ~30 ATP).
Glucose-basis accounting was chosen because textbook values are uncontroversial and directly comparable across steps. Fatty acid oxidation yields more ATP per molecule (~106 for palmitate) but runs through the same ETC, so the glucose basis is conservative and transferable. The distinction between direct and gated yields matters because several steps (PDC, cofactor supply, ANT export) produce no ATP directly but gate a large fraction of downstream ATP: their failure is catastrophic precisely because they are pipeline gates rather than producers.
Limitations. Textbook values apply under ideal conditions; real cellular yields are lower due to proton leak (10–20%) and substrate partitioning, already partly reflected in the 30-ATP figure. Partial failure is non-linear: 50% PDK inhibition does not produce 50% yield loss. Values apply to aerobic tissue (muscle, neurons); immune cells and other tissues have different dependency profiles. The accounting is a framework for ordering failure modes, not a quantitative predictor of ATP deficit in any specific patient.
2 The Ten Steps
| Step | Function | Direct | Gated | % total |
|---|---|---|---|---|
| 1 | Substrate delivery | 0 | ~30 | 100% |
| 2 | Glycolysis | +2 ATP, +2 NADH | ~30 | 100% |
| 3 | Pyruvate dehydrogenase (PDC) | +2 NADH (=+5 gated) | ~25 | ~83% |
| 4 | Carnitine shuttle / β-oxidation | 0 (glucose basis) | — | — |
| 5 | Krebs cycle | +2 GTP, +6 NADH, +2 FADH2 | ~20 | ~67% |
| 6 | Cofactors (CoQ10, FAD, NAD+, thiamine) | 0 direct | up to ~25 | up to ~83% |
| 7 | ANT (ATP export) | 0 | ~28 | ~93% |
| 8 | Creatine phosphate shuttle | 0 (kinetic buffer) | — | — |
| 9 | ROS scavenging | 0 (net-negative) | — | — |
| 10 | Dynamics / biogenesis | 0 (capacity setter) | — | — |
Step 4 (carnitine/β-oxidation) reports zero direct yield on a glucose basis because it is a fatty-acid-specific pathway; for palmitate the yield is +7 FADH2 + 7 NADH + 8 acetyl-CoA per molecule. Steps 8, 9, and 10 are not stoichiometric producers: creatine phosphate is a kinetic buffer, ROS scavenging is net-negative (consuming NADPH and glutathione), and dynamics/biogenesis is a longitudinal capacity setter. All three can fail without changing the per-cycle ATP count, yet their failure degrades overall system performance through kinetic, protective, and regenerative mechanisms respectively.
3 Cellular Energy Production Overview
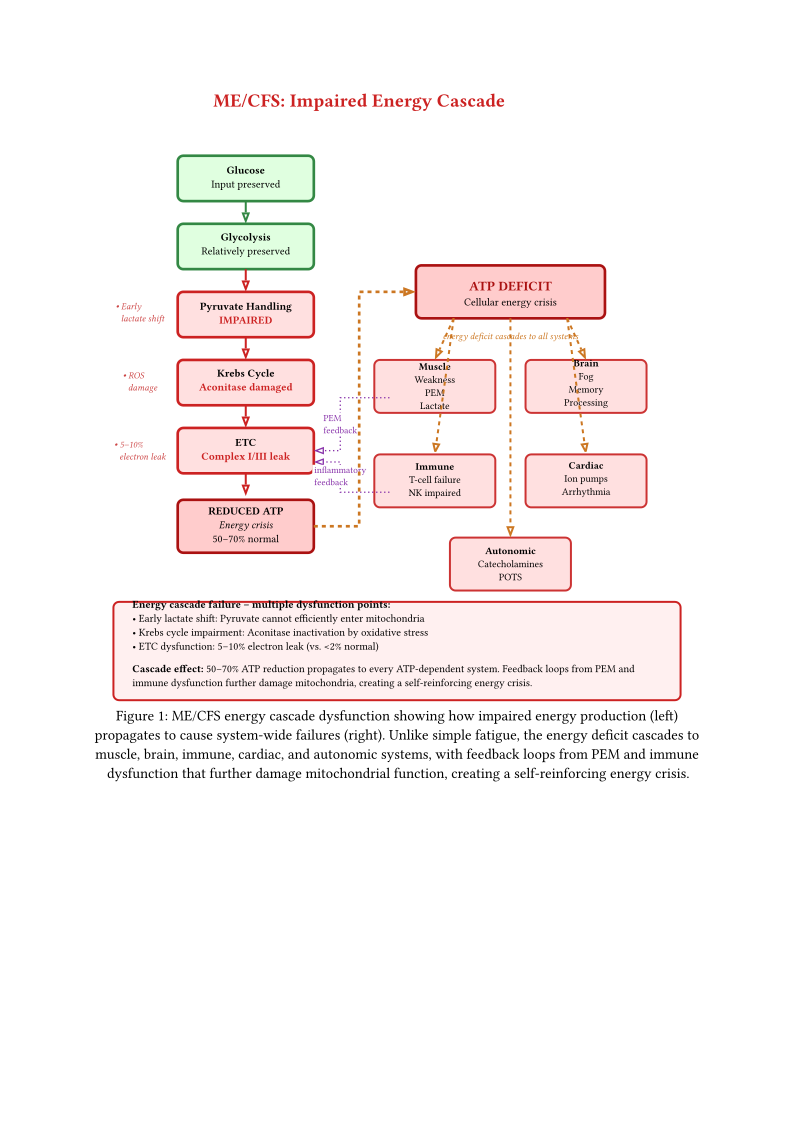
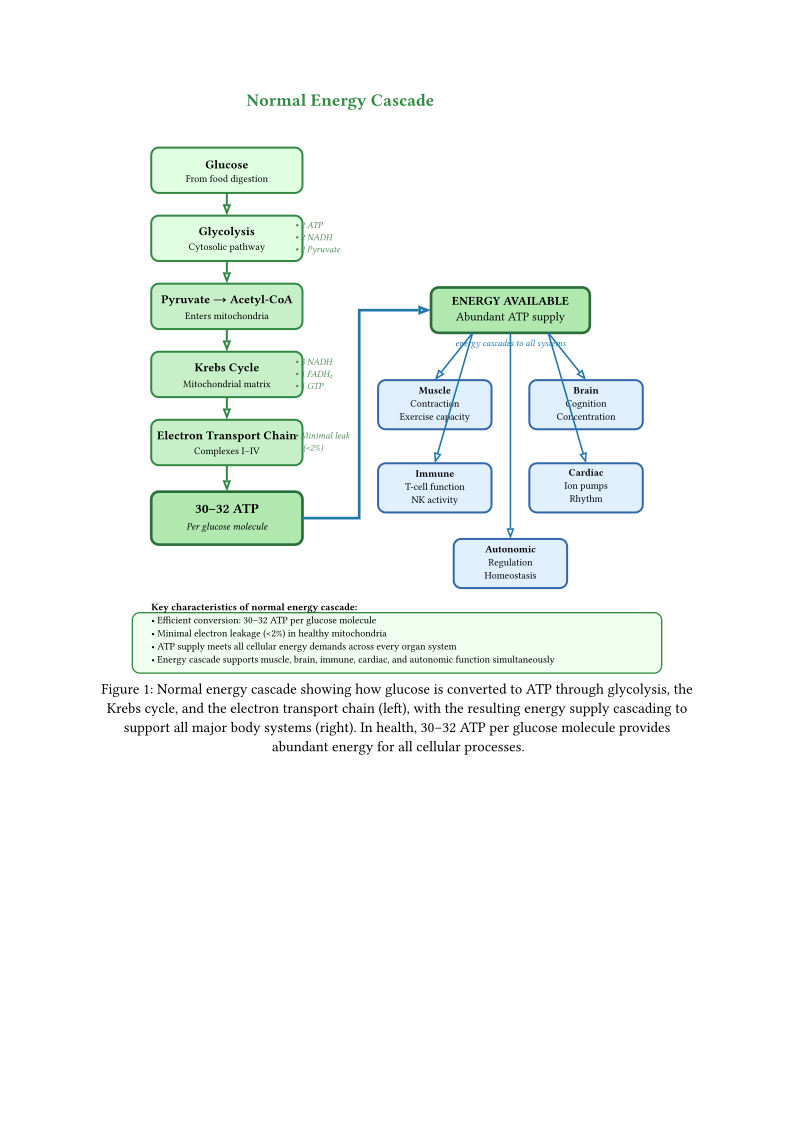
Adenosine triphosphate (ATP) is the universal energy currency of cells, powering virtually all cellular processes. ATP is generated through three interconnected pathways:
3.1 Glycolysis
Glycolysis occurs in the cytoplasm and converts glucose to pyruvate:
- Substrate: One glucose molecule (6 carbons)
- Products: Two pyruvate molecules (3 carbons each), 2 ATP (net), 2 NADH
- Oxygen requirement: None (anaerobic process)
- Rate: Fast but relatively inefficient
Glycolytic intermediates also provide substrates for biosynthetic pathways (amino acids, lipids, nucleotides), making glycolysis central to cellular metabolism beyond energy production.
3.2 Krebs Cycle (Citric Acid Cycle)
The Krebs cycle occurs in the mitochondrial matrix and completes glucose oxidation:
- Substrate: Acetyl-CoA (derived from pyruvate, fatty acids, or amino acids)
- Products per acetyl-CoA: 3 NADH, 1 FADH2, 1 GTP (equivalent to ATP), 2 CO2
- Function: Generates reducing equivalents (NADH, FADH2) for electron transport chain
- Regulation: Controlled by substrate availability, product inhibition, and allosteric regulators
3.3 Electron Transport Chain and Oxidative Phosphorylation
The electron transport chain (ETC) in the inner mitochondrial membrane generates the majority of cellular ATP:
- Complex I (NADH dehydrogenase): Accepts electrons from NADH, pumps protons
- Complex II (Succinate dehydrogenase): Accepts electrons from FADH2, does not pump protons
- Complex III (Cytochrome bc1): Transfers electrons to cytochrome c, pumps protons
- Complex IV (Cytochrome c oxidase): Transfers electrons to O2 (forming H2O), pumps protons
- Complex V (ATP synthase): Uses proton gradient to synthesize ATP from ADP + Pi
Complete oxidation of one glucose molecule yields approximately 30–32 ATP, though actual yield varies with cellular conditions.
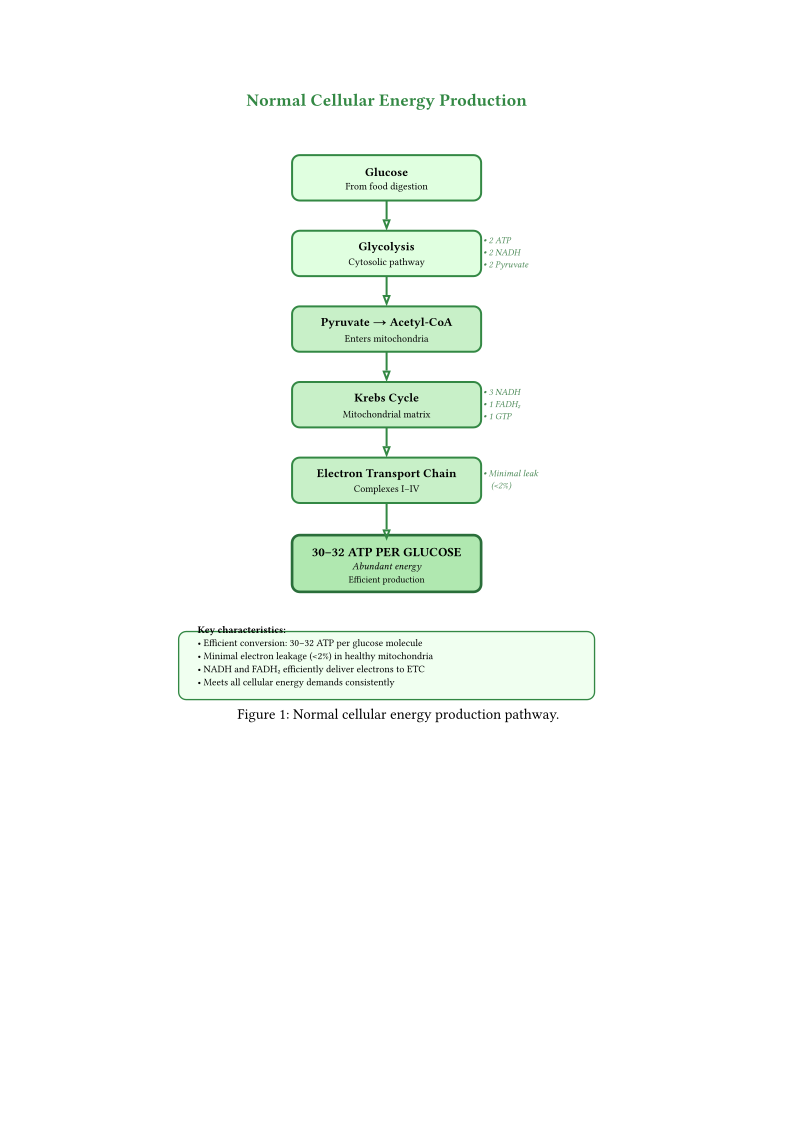
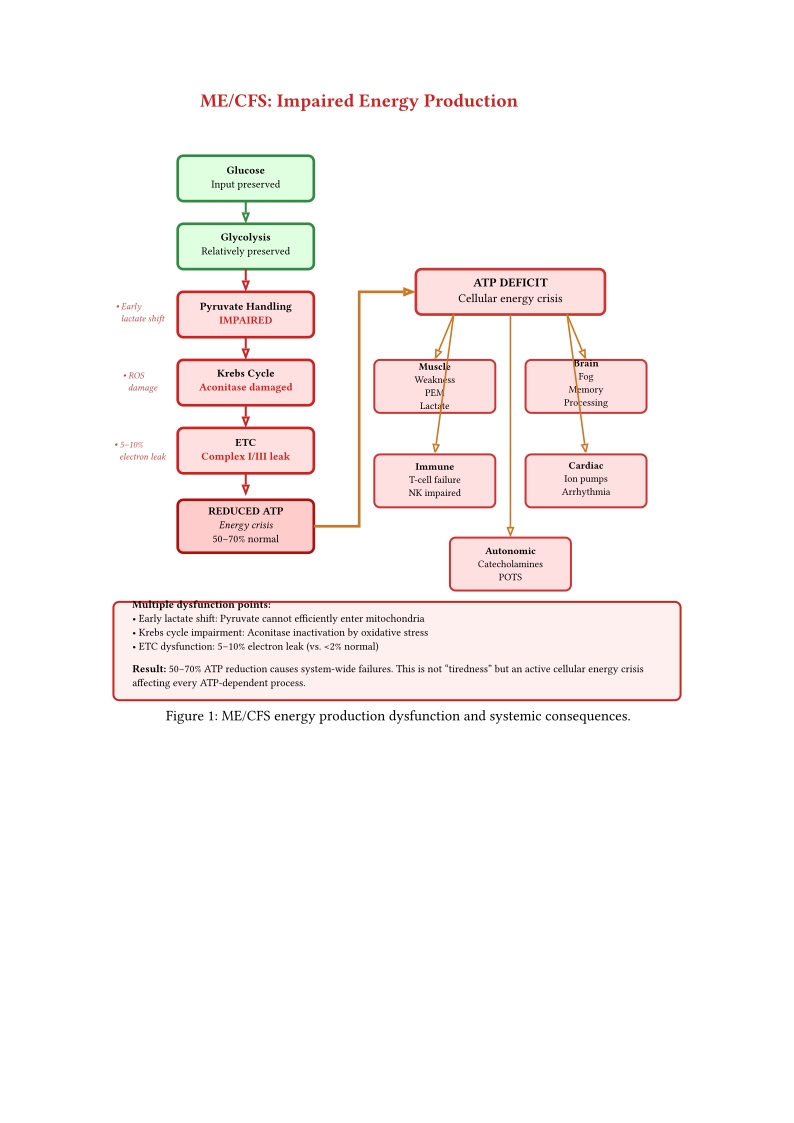 Figures energy cascade normal and energy cascade mecfs illustrate normal ATP production and the multiple impairment points in ME/CFS. ATP deficit cascades into multi-system dysfunction affecting muscle, brain, immune, cardiovascular, and autonomic systems. This multi-system cascade is synthesized with other pathophysiological mechanisms in Chapter Integrative Models and Multi-System Pathophysiology, particularly in the discussion of energy-immune-autonomic interactions (Section Multi-System Integration and Synthesis).
4 Normal Energy Metabolism
4.1 Baseline ATP Requirements
Different tissues have vastly different energy demands:
- Brain: 20–25% of resting metabolic rate despite 2% of body mass
- Heart: Continuously contracting, requires constant ATP supply
- Skeletal muscle: Variable demand; enormous increase during exercise
- Immune cells: High energy demand during activation
- Liver: Metabolic hub with substantial ATP consumption
The human body produces and consumes approximately 40–70 kg of ATP daily, with turnover occurring every few seconds.
4.2 Energy Demands During Exertion
Physical activity dramatically increases ATP demand:
- Muscle ATP consumption: Can increase 100-fold during maximal exercise
- Immediate energy: Phosphocreatine provides seconds of buffering
- Short-term: Glycolysis provides rapid but limited ATP
- Sustained activity: Requires oxidative phosphorylation
- Substrate shift: From glucose to increasing fatty acid utilization
4.3 Recovery Processes
Following exertion, energy systems must be restored:
- Oxygen debt repayment: Elevated metabolism to restore baseline
- Phosphocreatine resynthesis: Rapid recovery (seconds to minutes)
- Glycogen resynthesis: Hours to days depending on depletion
- Lactate clearance: Conversion back to glucose (Cori cycle)
- Protein synthesis: Repair of exercise-induced damage
5 Evidence for Mitochondrial Impairment
Mitochondria are increasingly recognized as central to ME/CFS pathophysiology, with evidence for dysfunction at multiple levels. The evidence reviewed here is organized by measurement modality rather than by step in the energy chain; findings are then attached to specific steps in the ten-step analysis that follows.
5.1 Studies Showing Reduced ATP Production
Multiple lines of evidence support impaired ATP generation:
- Lymphocyte studies: Reduced ATP production in peripheral blood mononuclear cells
- Muscle biopsies: Abnormal mitochondrial morphology and function in some patients
- Metabolomic profiles: Patterns consistent with impaired oxidative phosphorylation
- Exercise studies: Early transition to anaerobic metabolism (reduced anaerobic threshold)
The ATP Profile Test One proposed biomarker approach measures:
- ATP concentration in neutrophils
- ATP production efficiency
- Mitochondrial membrane potential
Studies using this approach have found reduced ATP levels and impaired efficiency in ME/CFS patients, though methodological debates continue.
A landmark 2025 study by Heng et al. (Heng et al. 2025), published in Cell Reports Medicine, applied multi-omics analysis to 61 ME/CFS patients (Canadian Criteria) matched with 61 healthy controls, revealing coordinated dysfunction across energy metabolism, immune function, and vascular systems. Key energy metabolism findings included elevated adenosine monophosphate (AMP) and adenosine diphosphate (ADP) in white blood cells, with median AMP levels of 312.2 nM in ME/CFS versus 147.2 nM in controls, reduced ATP/ADP ratio consistent with decreased ATP generation and cellular energy stress, and abnormal nicotinamide adenine dinucleotide (NAD+) metabolism affecting cellular energy production.
The study identified a predictive model comprising seven biological variables that distinguished ME/CFS patients with 85.2% sensitivity, 96.7% specificity, and 91% accuracy. These seven biomarkers span adenosine metabolism (AMP), immune functions (cDC1, LYVE1, IGHG2), and vascular factors (FN1, VWF, THBS1)—demonstrating that energy dysfunction in ME/CFS is not isolated but integrated with immune and vascular abnormalities. This multi-system integration suggests that future treatments may need to target energy metabolism, immune maturation, and vascular health simultaneously. The implications of this coordinated dysfunction for treatment strategy are discussed in Chapter Integrative Models and Multi-System Pathophysiology, particularly in the context of the Energy-Immune-Autonomic Triad (Section Multi-System Integration and Synthesis). For the systems biology perspective on this biomarker panel, see Achievement Research Questions and Future Directions in Chapter Integrative Models and Multi-System Pathophysiology.
Single study (Heng 2025, n=61 pairs) from one Australian center. No independent cohort has replicated the multi-omics biomarker panel or its diagnostic accuracy. The CART-derived 7-biomarker model requires prospective validation in independent populations with diverse demographics and diagnostic criteria before clinical application. Independent replication required.
Cullen et al. (Cullen et al. 2026) found that cells from young adults with major depression produce paradoxically elevated ATP at rest but show markedly reduced capacity to upscale energy output under metabolic stress—a pattern they term stress-responsive mitochondrial failure. This phenotype is conceptually similar to the post-exertional energy collapse in ME/CFS: near-normal baseline function until an energy demand threshold is exceeded, whereupon output fails catastrophically. Whether ME/CFS mitochondria share this specific regulatory defect (rather than, or in addition to, absolute ATP deficiency) remains to be directly tested in ME/CFS populations. Study: (\(n=18\), major depression cohort, Translational Psychiatry 2026, certainty: 0.40; relevance to ME/CFS is speculative).
5.2 Electron Microscopy Findings
Ultrastructural examination of mitochondria has revealed:
- Abnormal morphology: Swollen, disrupted cristae structure
- Variable size: Both enlarged and fragmented mitochondria
- Reduced number: Decreased mitochondrial density in some tissues
- Intramuscular abnormalities: Changes in muscle biopsy specimens
5.3 Functional Assays
Direct measurement of mitochondrial function shows:
- Respirometry: Reduced oxygen consumption rates in some studies
- Enzyme activities: Variable findings for individual ETC complexes
- Membrane potential: May be altered, affecting ATP synthesis efficiency
- Calcium handling: Impaired mitochondrial calcium uptake
5.4 Biomarkers of Mitochondrial Dysfunction
Several biomarkers indicate mitochondrial stress:
- Lactate: Elevated at rest or with minimal exertion
- Pyruvate: Altered lactate/pyruvate ratio
- Organic acids: Abnormal urinary organic acid patterns
- Acylcarnitines: Reflecting impaired fatty acid oxidation
- Coenzyme Q10: Sometimes reduced